1 Quality testing our lenses
We just received updated lenses from our optics suppliers and ran some QA tests on them.
TLDR: We're pretty blown away by how good things look in person. Even without software distortion correction, text and other fine details are extremely crisp. We can't wait to show this quality off in our review units.
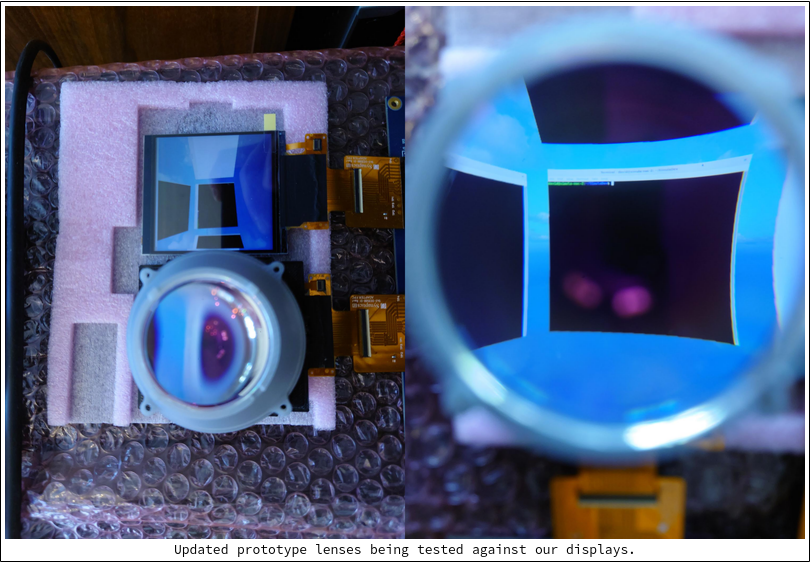
The lenses are being cradled by our custom lens holders (shown in gray); we still have some iteration left on these holders, but they're reasonably close to their final form.
To be fair: things aren't yet perfect. For example there are still some chromatic abberations (color distortions) around the lens edges, which are visible in these shots. This will be fixed via our monado distortion code (see below).

One other disclaimer: the shots we're taking here are just with our phone, so admittedly things don't look as good here as they do in person.
1.1 Distortion profile
The first thing to notice is that our lens distortion profile looks reasonably good: images look squished together towards the center of the lenses and stretched apart at the edges. This is exactly how they're supposed to look, as per our optical design.
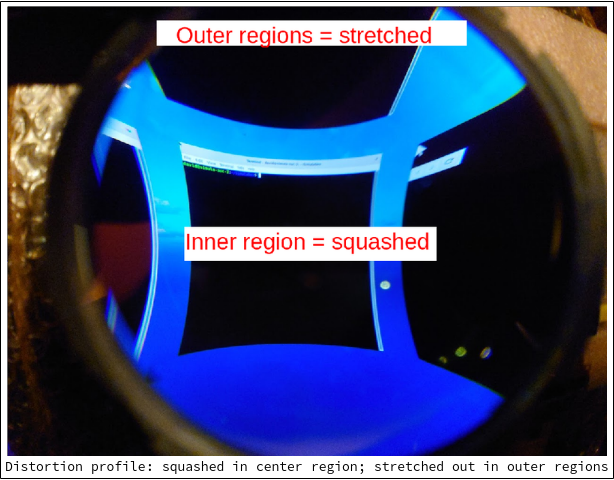
Of course, no distortion like this will be visible in final headsets. We are only looking at images before "distortion correction" software rendering is applied (see below).
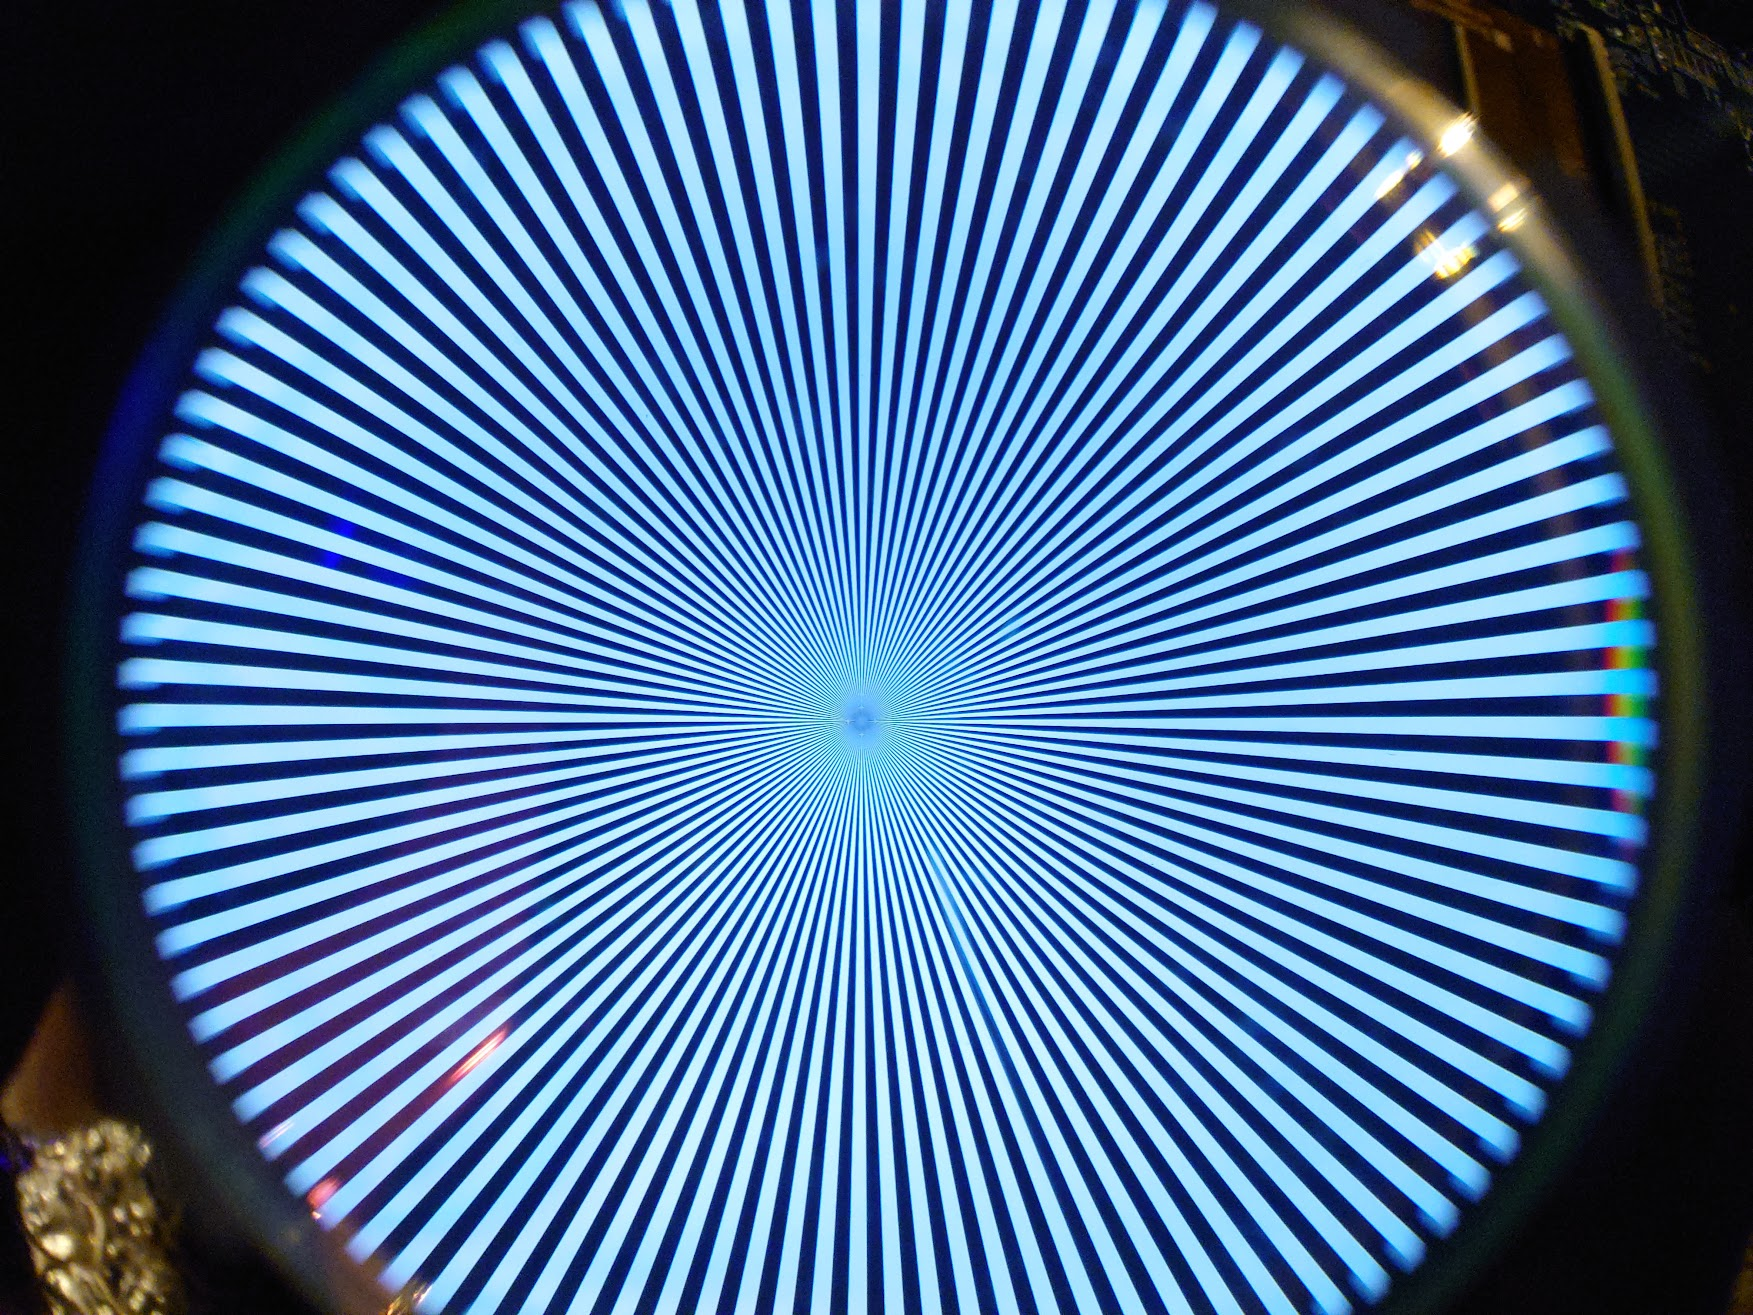
1.2 Siemens star test
To inspect for image quality, we can render a Siemens star and see how it looks. A Siemens star consists of bright "spokes" that radiate from a common center (getting wider the further they get from the center). In theory, the spokes meet at the exact center of the Siemens star; when printed or displayed on a device with resolution limitations, however, the spokes will touch at some distance from the center. This makes it a useful tool for inspecting pixel density/image quality:
We can also render a checkboard through our display + lens setup as well:
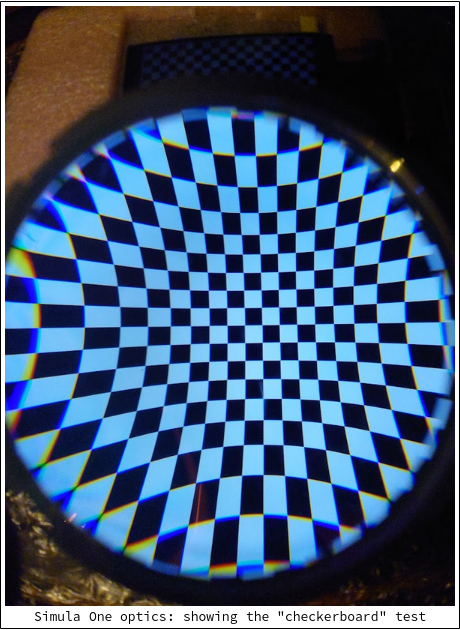
This makes the chromatic abberations on the edges painfully obvious (to be fixed).
1.3 Rendering Simula
The final test is actually rendering Simula. Here we can start to get a sense for how text quality appears:
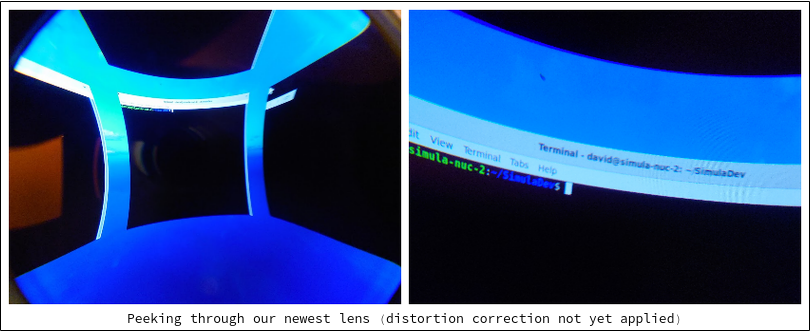
Keep in mind this shot is being taken through a smart phone. Everything looks much better in person.
1.4 Distortion pseudocode
As mentioned in our pixel density post, we must "de-distort" images at the software/rendering level in order for things to look normal. The code for this will be implemented in our monado plugin, and will look something like the following:
//This pseudocode is based on 'u_compute_distortion_vive' function
// Somewhere at the program (constants definition)
/* Display size in mm */
float _DispDimsX = ...
float _DispDimsY = ...
/* Half of the horizontal field of view (in radians) fovH/2 */
float _FoVh_2 = ...
/* Field of view aspect ratio (fovH/fovV), equals to 1 if fovH = fovV */
float _aspect = ...
...
struct xrt_vec2 tc[3];
...
// Just before applying the polynomial (maybe before the loop or at the beginning of it)
// Denormalization: conversion from uv texture coordinates (origin at bottom left corner) to mm display coordinates
struct xrt_vec2 XoYo = {0,0};            // Assuming (0,0) at the center of the display: -DispDimsX/2 <= XoYo.x <= DispDimsX/2; -DispDimsY <= XoYo.y <= DispDimsY
XoYo.x = _DispDimsX *(u - 0.5);
XoYo.y = _DispDimsY *(v - 0.5);

struct xrt_vec2 tanH_tanV = {0,0};   // Resulting angular coordinates (tan(H), tan(V)) of input image corresponding to the coordinates of the input texture whose color will be sampled

float r2 = m_vec2_dot(XoYo, XoYo);
float r = sqrt(r2);

// 9 degree polynomial (only odd coefficients)
float k1 = ...
float k3 = ...
float k5 = ...
float k7 = ...
float k9 = ...
float k = r * (k1 + r2 * (k3 + r2 * (k5 + r2 * (k7 + r2 * k9))));

// Avoid problems when r = 0
if (r > 0) {
    tanH_tanV.x = (k * XoYo.x) /r;
    tanH_tanV.y = (k * XoYo.y) /r;
} else {
    tanH_tanV.x = 0;
    tanH_tanV.y = 0;
}

// Normalization: Trasformation from angular coordinates (tan(H), tan(V)) of input image to tc (normalized coordinates with origin at the bottom left corner)
tc[i].x = (tanH_tanV.x + tan(_FoVh_2)) / (2 * tan(_FoVh_2));
tc[i].y = ((tanH_tanV.y + tan(_FoVh_2) / _aspect) / (2 * tan(_FoVh_2))) * _aspect;
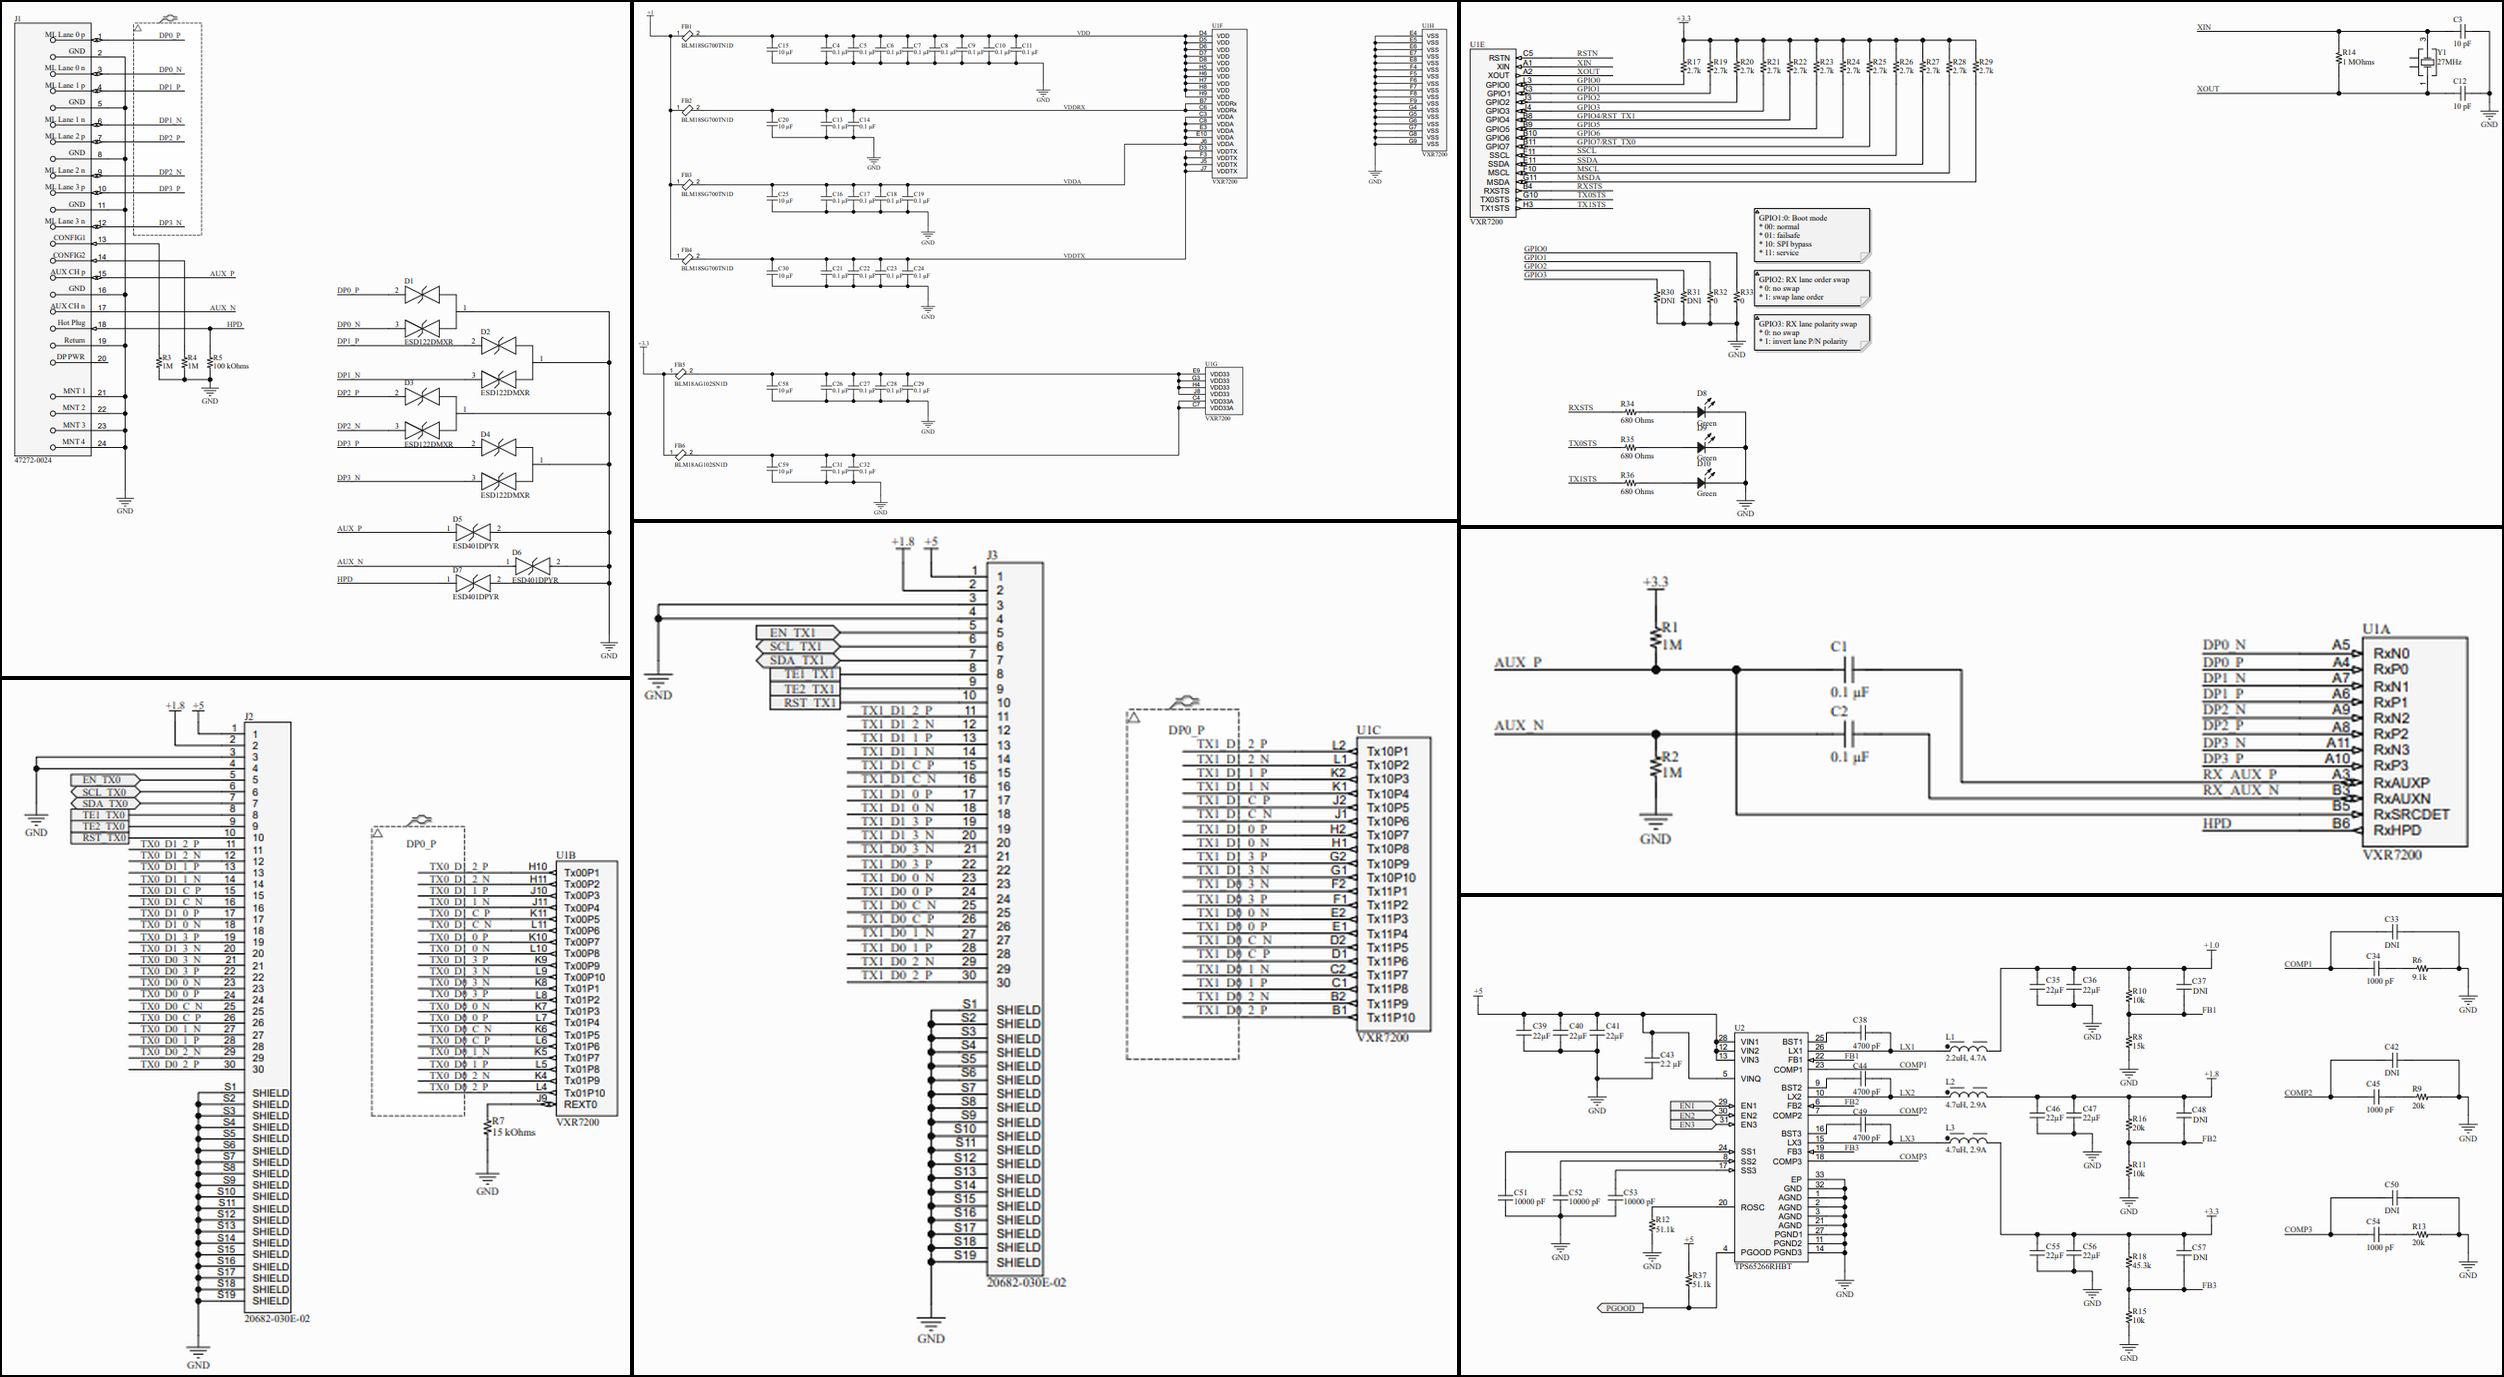
2 Schematics for our VXR7200 board & interposer

Recall from a recent display post that we are placing a Synaptics VXR7200 between our onboard computer and our two VR displays (to convert a DisplayPort lane to two MIPI-DSI streams). We have uploaded PCB design schematics for our custom VXR7200 assembly, as well as an interposer which fits between it and our VR displays:
The code can be found on GitHub:
If you're just interested in seeing our current schematics more closely, they can be found here:
See you next week!