Over the years we've run into many bugs: everything from subtle rendering artifacts to input mishandling to lower level memory leaks. The list really does go on. More recently, we've been working on Simula's performance bugs (since we need Simula to run well on our new VR/AR compute packs).
Since all of Simula's high-level code is written in Haskell, we have a pretty good system for catching type-level bugs at compile time, and it's nice we don't have to deal as much with those. Unfortunately, this doesn't always translate very well into catching bugs or understanding program behavior at run-time, which we've come to realize is super underrated.
So to make our lives easier (and for those who use our software too), we made Simula's compositor into more of a live inspectable environment (a step towards something more "moldable"):
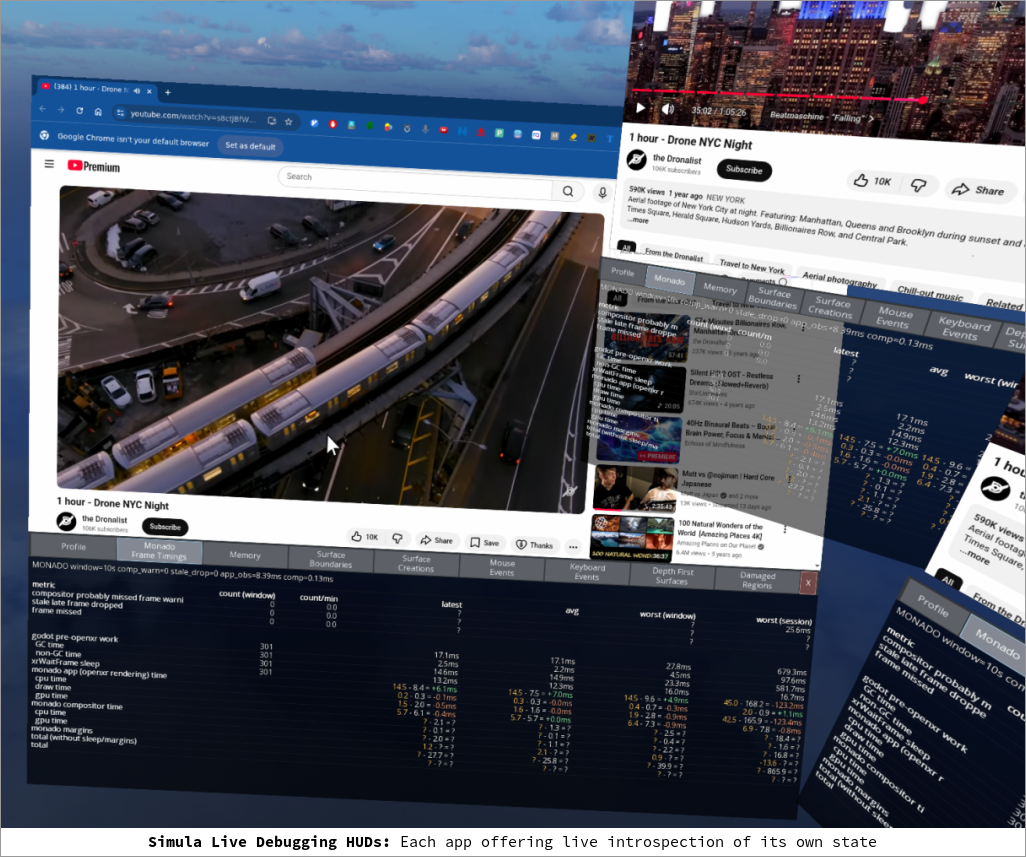
In less abstract terms: we added toggleable debug HUDs (which run underneath Simula app windows) which allow users to do things like inspect runtime window state and/or see what part of our rendering stack could be bottlenecking performance.
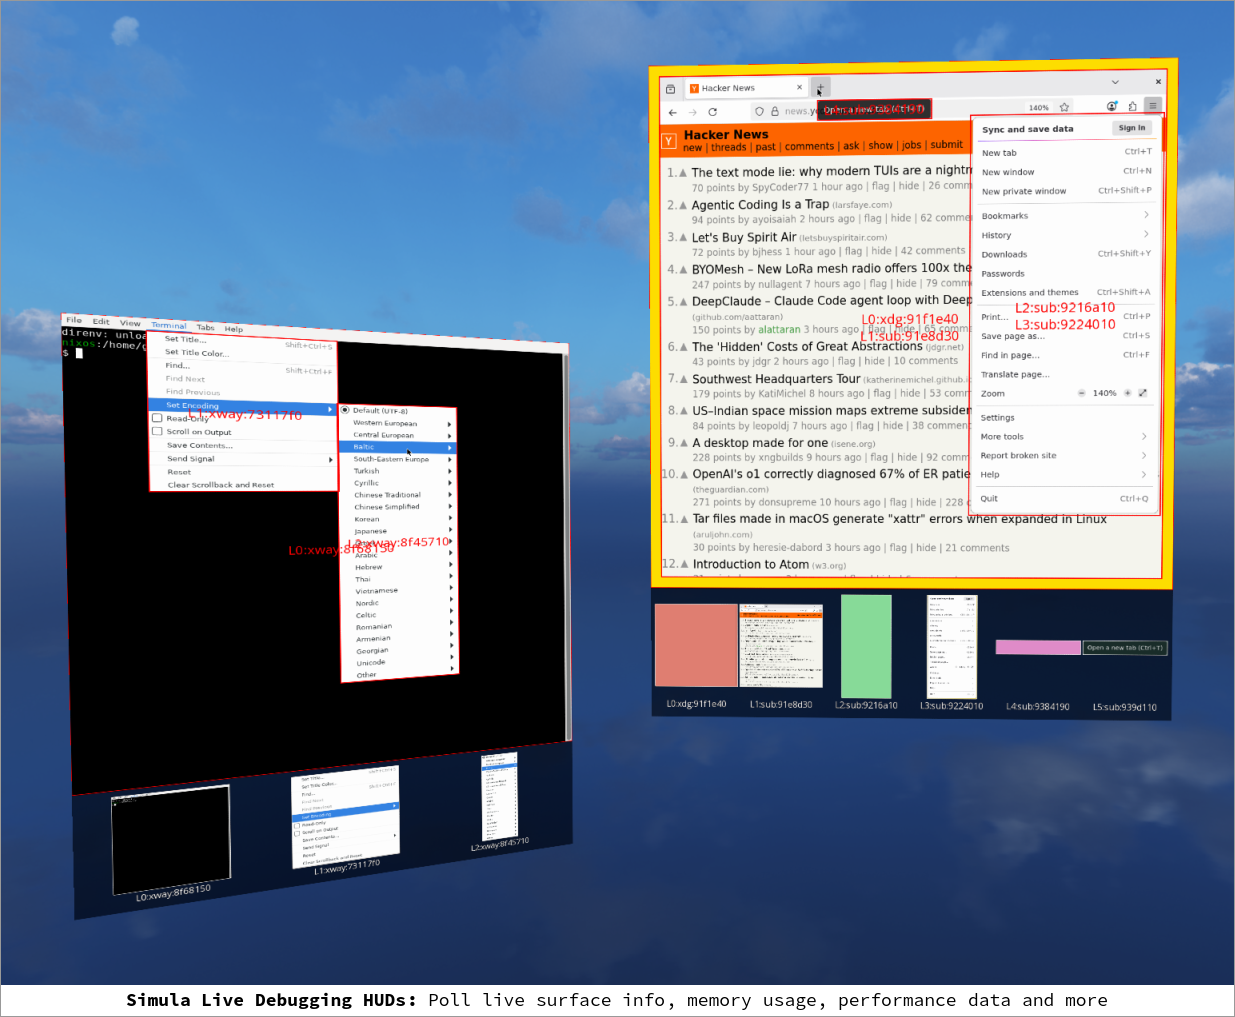
Interactive Debug Views
Here's an overview of some of our debug views. Each one of them solved a real problem we were working on, and then came to become a permanent part of our debugging infrastructure:
| Live Function Profiling: | See how long Haskell functions are taking to run as the compositor executes. |
|---|---|
| Live Frame Budget Inspection: | Shows how long each part of the rendering process is contributing to the current frame's budget (including GHC garbage collector spikes). |
| Live Memory (Godot Object) Inspection: | See how opening popups, moving the cursor around, or other actions affect Godot object counts (useful for detecting runaway object leaks). |
| Damaged Region Overlay: | See what part of an app is getting re-rendered ("Damaged Regions") and what textures are being blended over those damaged regions. |
| Surface Creations/Destruction: | See log traces for surfaces & subsurfaces as they get created and destroyed (including those not meant to be visible to the user). |
| Surface Boundaries: | See what Simula thinks the boundaries of subsurfaces are/should be (inclusive or exclusive of window decorations). |
| Mouse & Keyboard Events: | See how Simula is intercepting keyboard & mouse events, and what subsurfaces they are being routed to. |
| Surface Rendering Viewer: | Inspect the subsurfaces of a running app in the depth order that Simula is rendering them. |
Below we dive into more depth:
Live Function Profiling
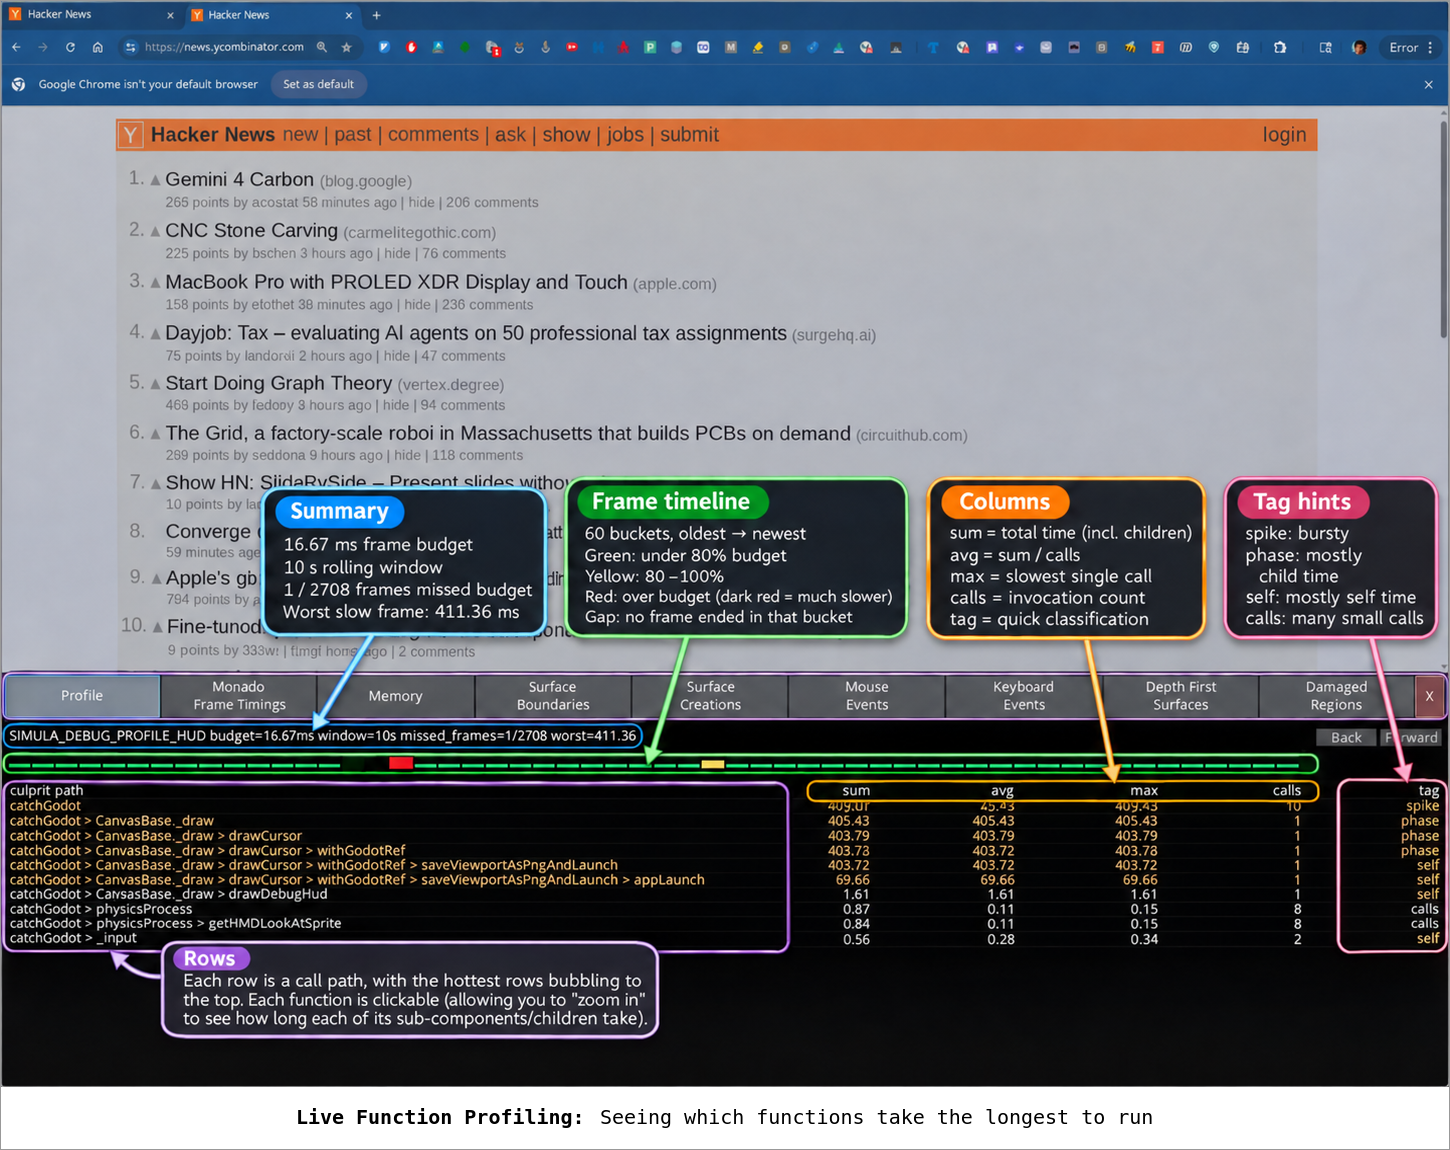
Simula's live profiling HUD allows you to see the raw wallclock-elapsed time of running Haskell functions:
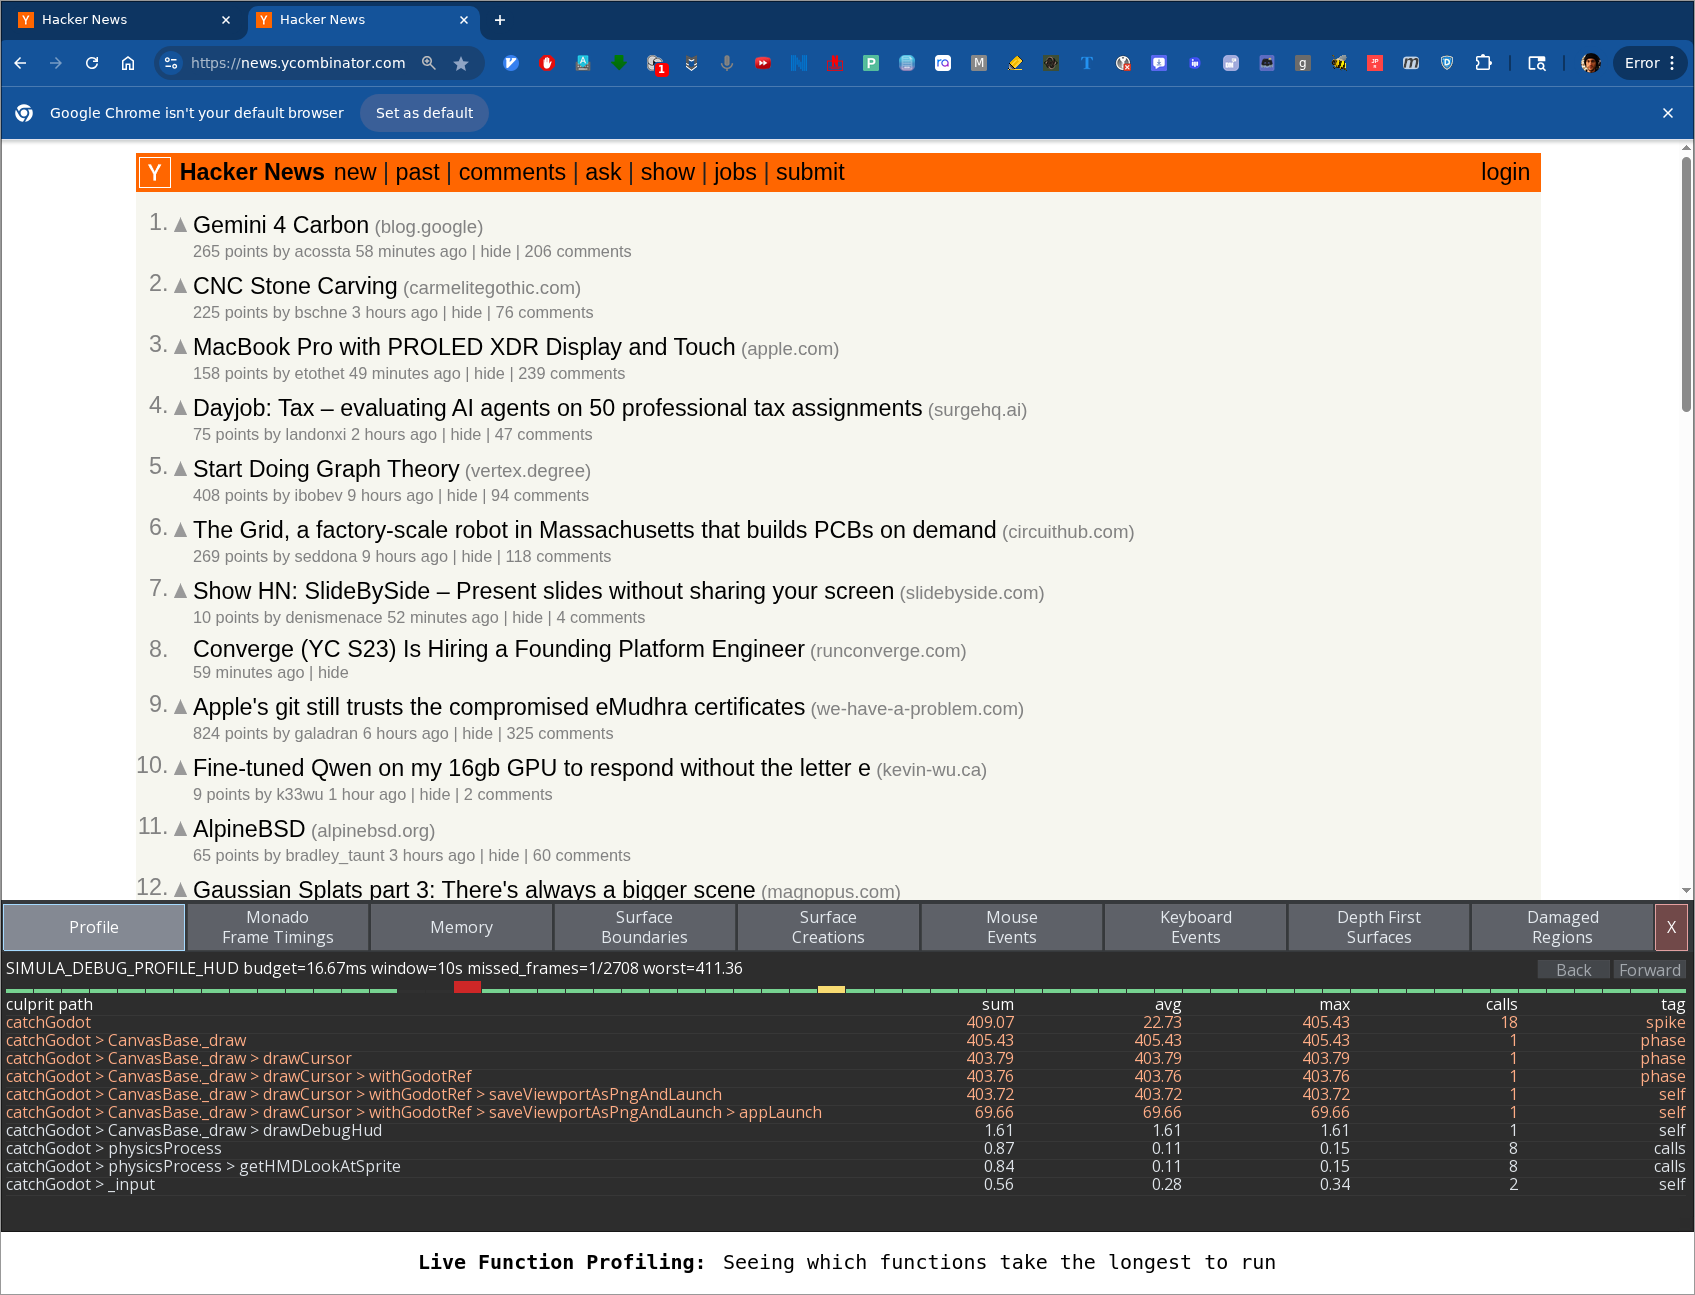
This profiling view is updated roughly once per second (toggleable by the user). The way it works is that all running Haskell functions are basically thrown into 60-frame buckets, where various time-elapsed stats are displayed. On the left, function names are automatically sorted (with the most expensive ones shown first), where you're able to click into any of them to dive into more details. E.g. here's a user zooming into a function (setTargetDimensions), to probe for more profiling data on just that call:
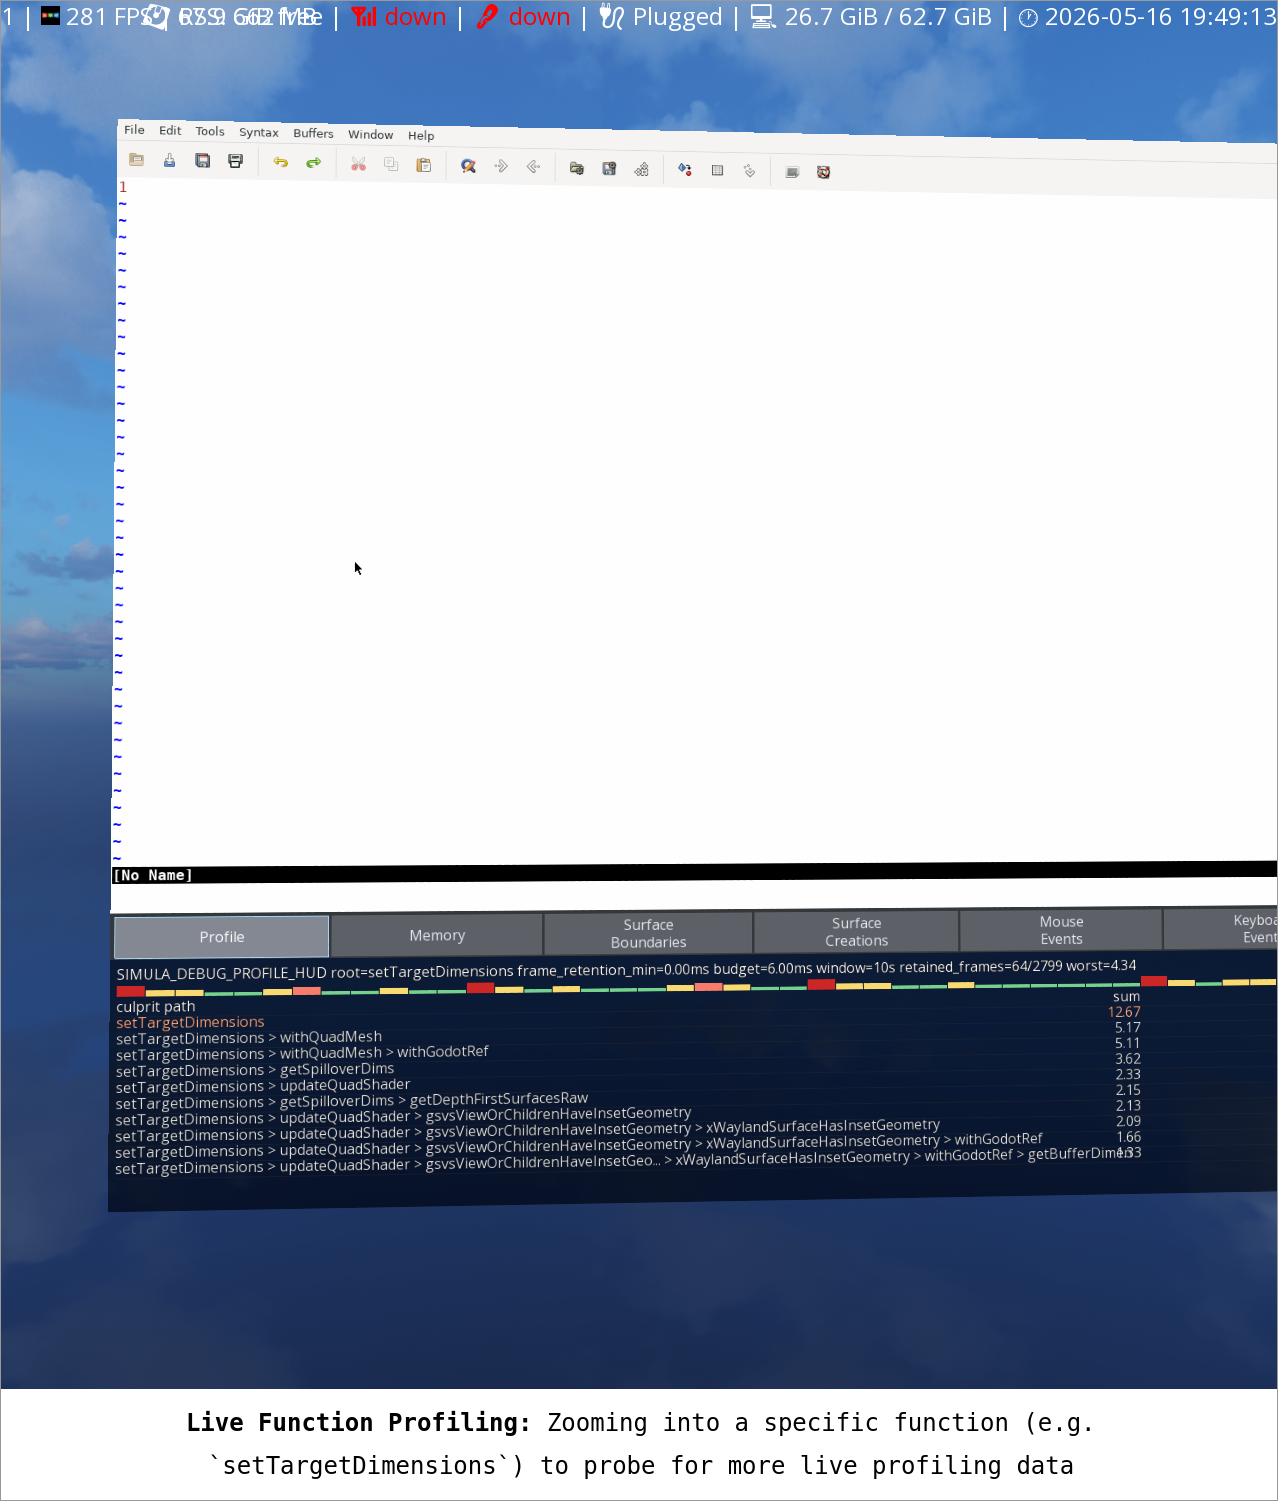
On top of the HUD, a live frame graph is also updated, so you can get a sense of how frequent "missed frames" are occuring (e.g. frames that failed to draw on time against your VR headset's refresh rate) and what behaviors might be causing them. Here's an annotated view of what everything means:
Godot Object Counts
Simula is built over a fork of the Godot Game Engine, which follows a traditional "everything in the game is a live object in a scene graph" model. This means that basically everything in Simula (from popups to mouse cursors) is a Godot object somewhere in the scene graph. Because of this, memory leaks are often the result of an imabalance between Godot objects getting created and then never getting destroyed. So it's useful to have a snapshot view of how many Godot objects are currently live, and then from there how those object counts change over time.
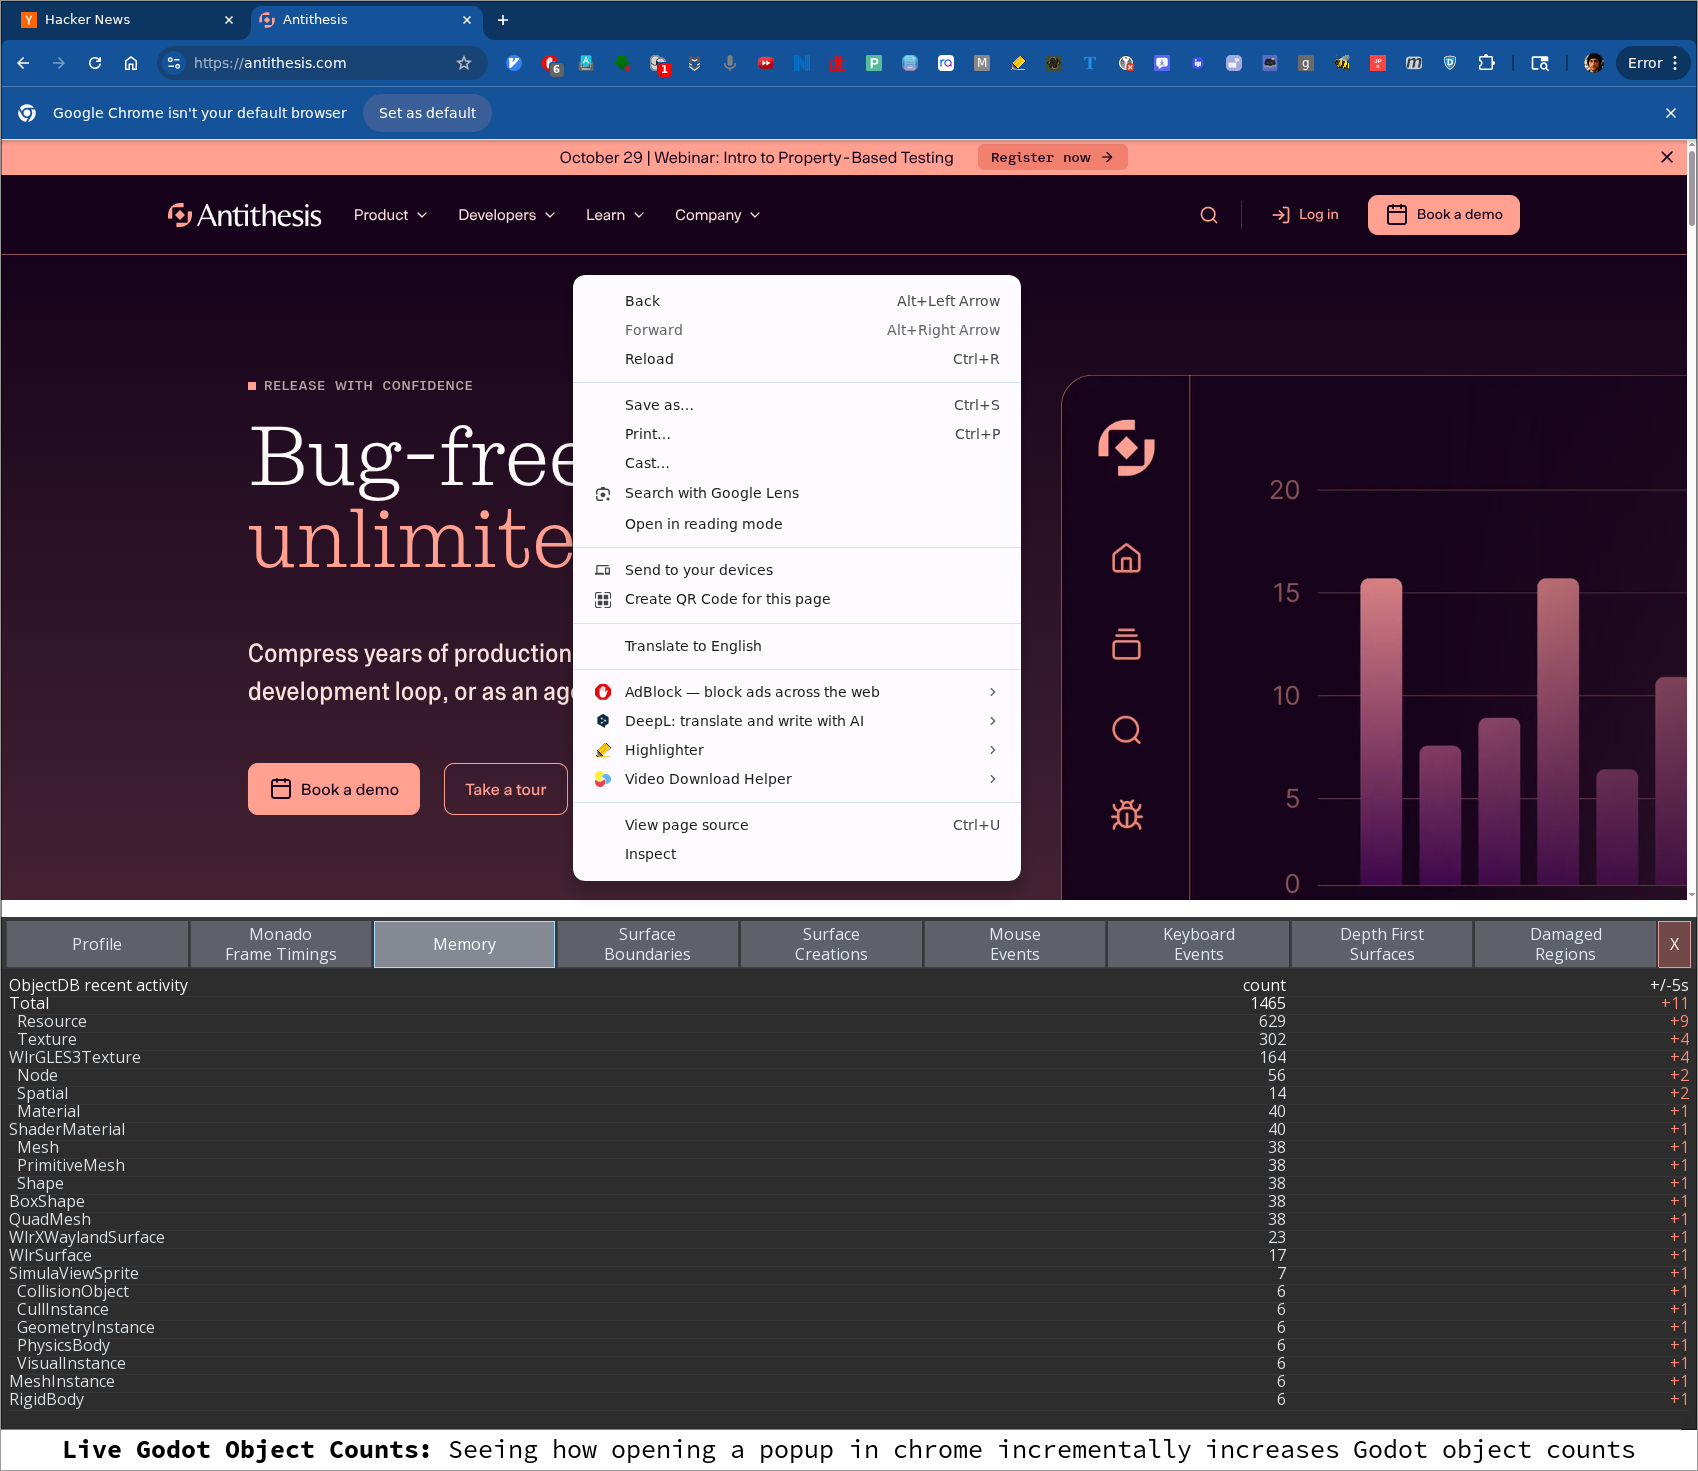
For example, suppose in Simula we open a popup in chrome. In our debug HUD at the bottom, we can see a myriad of Godot objects being created as Simula intercepts the popup event and creates a bunch of things with it:
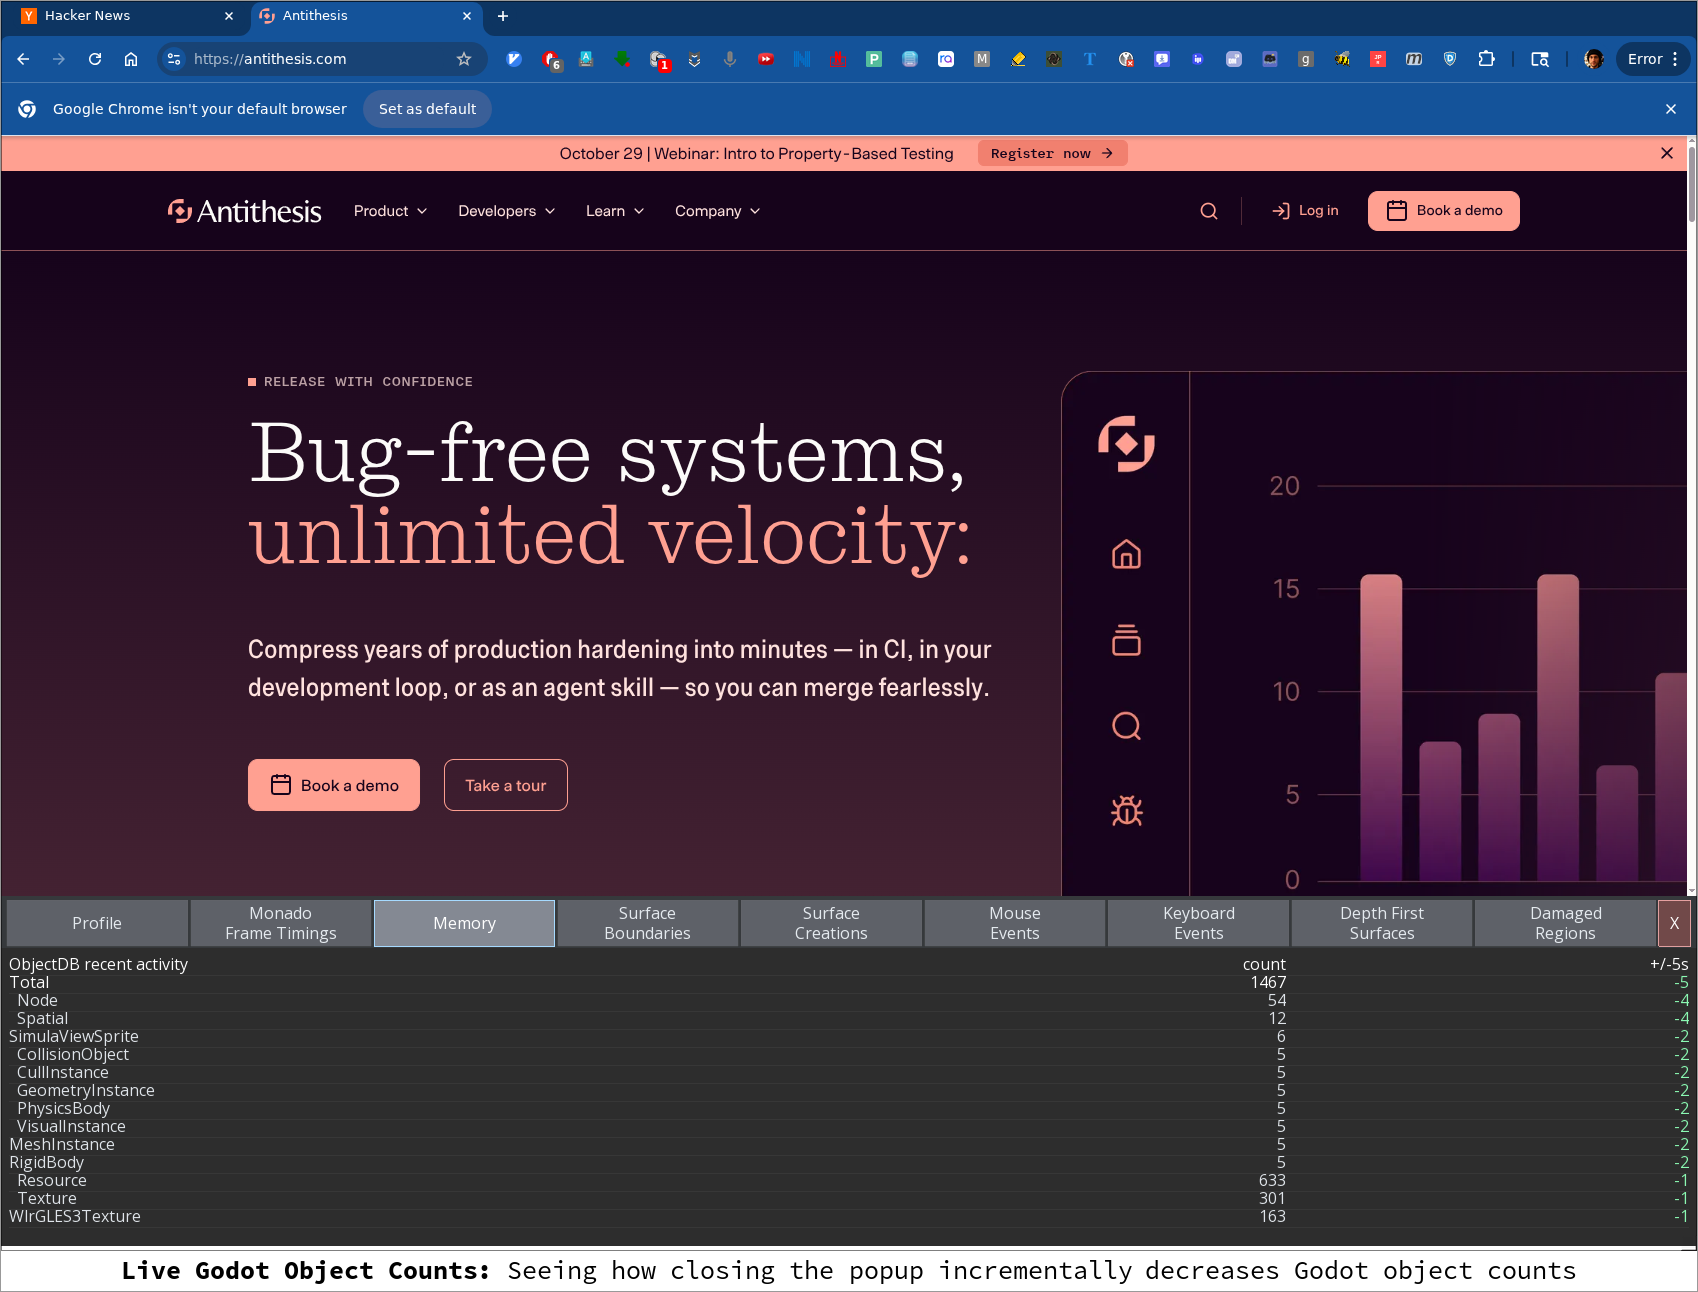
On the other hand, when we close this popup, we can then see a lot of objects getting deleted:
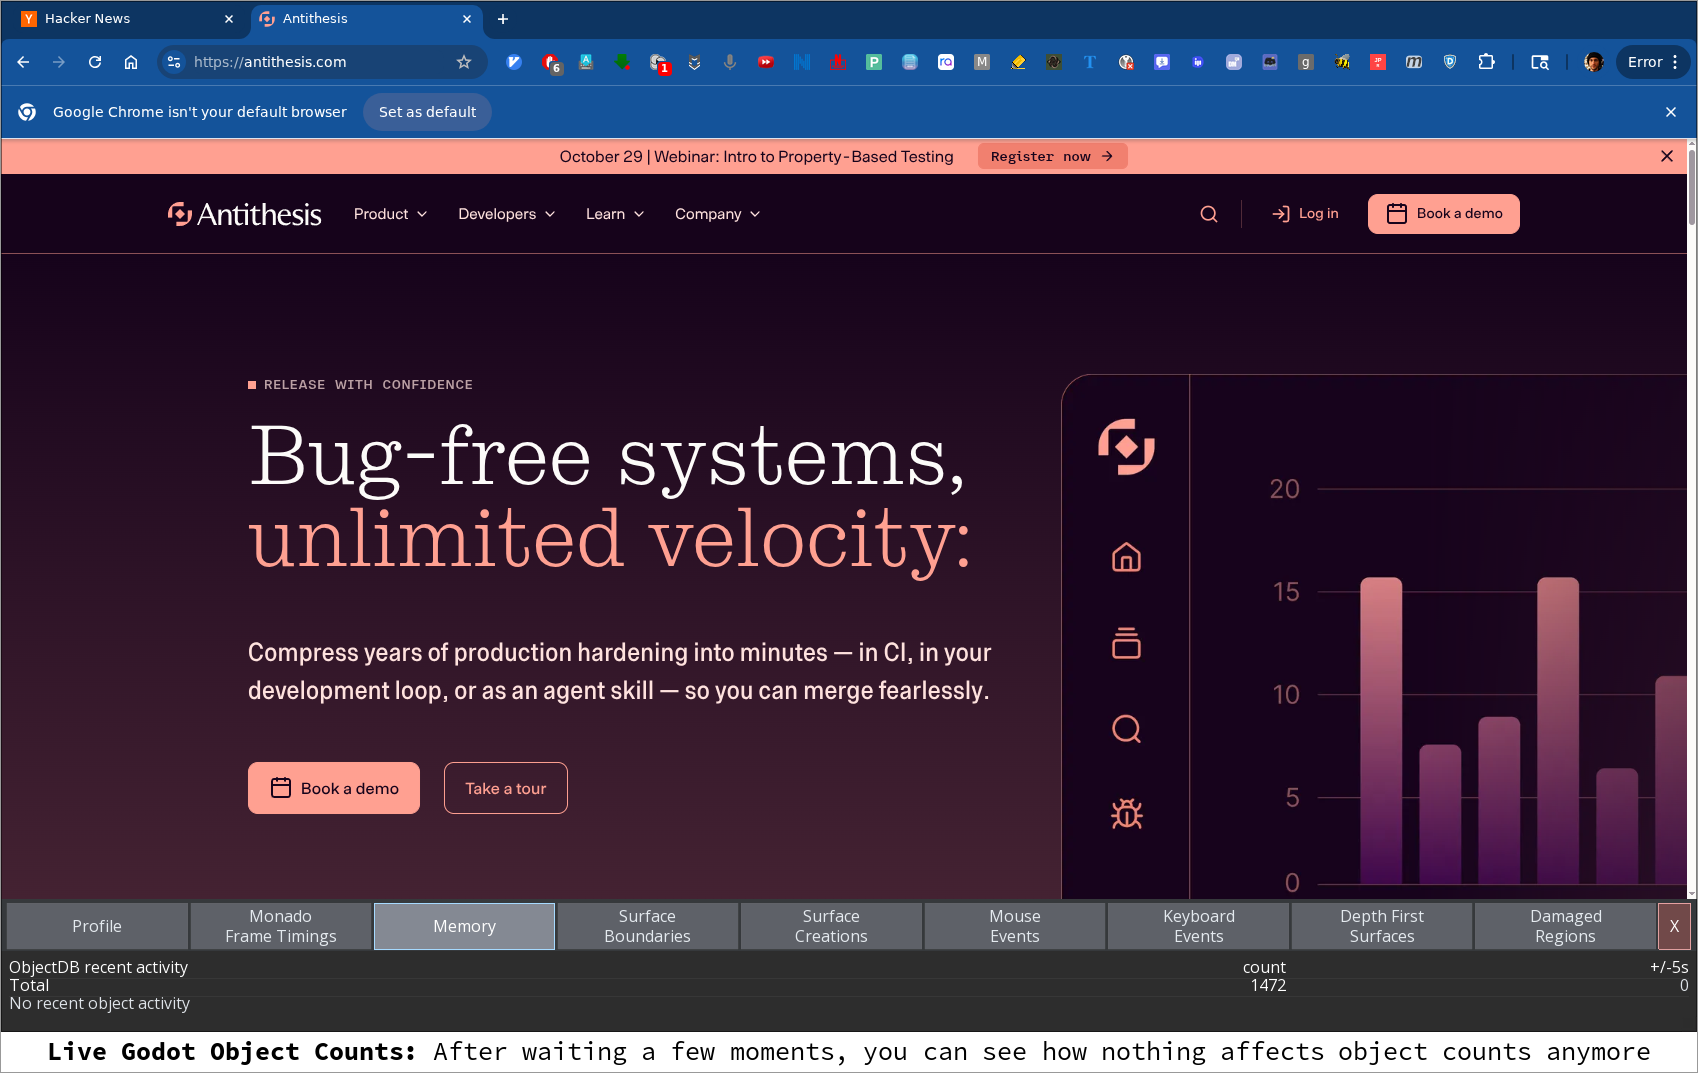
If we wait around a bit longer, we'll eventually see no more object creation/destructions as things stabilize:
Though this debug view is useful, it isn't super precise. It's still possible for objects to be left hanging around until e.g. some other parent object is deleted. And textures and other things in the background are also constantly being churned (making precise accounting sometimes difficult). But it's still quite useful for seeing if you have true runaway object creations happening in a loop somewhere, and we've used this view already to fix memory bugs that weren't super obvious until we were able to play around with things while Simula was actually running.
Damaged Regions Overlay
You might think that Simula apps get redrawn every frame, but this isn't true! It's often unnecessary to redraw an app in its entirety.
Say e.g. you're in a text editor and you press the a key to write an "a". In theory, the only thing that might need to be redrawn is just that "a". For this reason, Wayland compositors (like Simula) have a protocol which (i) allows client apps to handle their own redrawing but (ii) also allows them to tell the compositor the parts of their surfaces that actually changed/need redrawn in the window manager. These surface areas that need redrawn are called "damaged regions", and Simula now allows you to view them frame-by-frame via two views.
The first view is over the top of the app itself: here damaged regions show up as purple rectangles on a frame-by-frame basis (causing brief flickers of purple to flash as things get repainted). For example, here's a shot of gvim with a popup opening up:
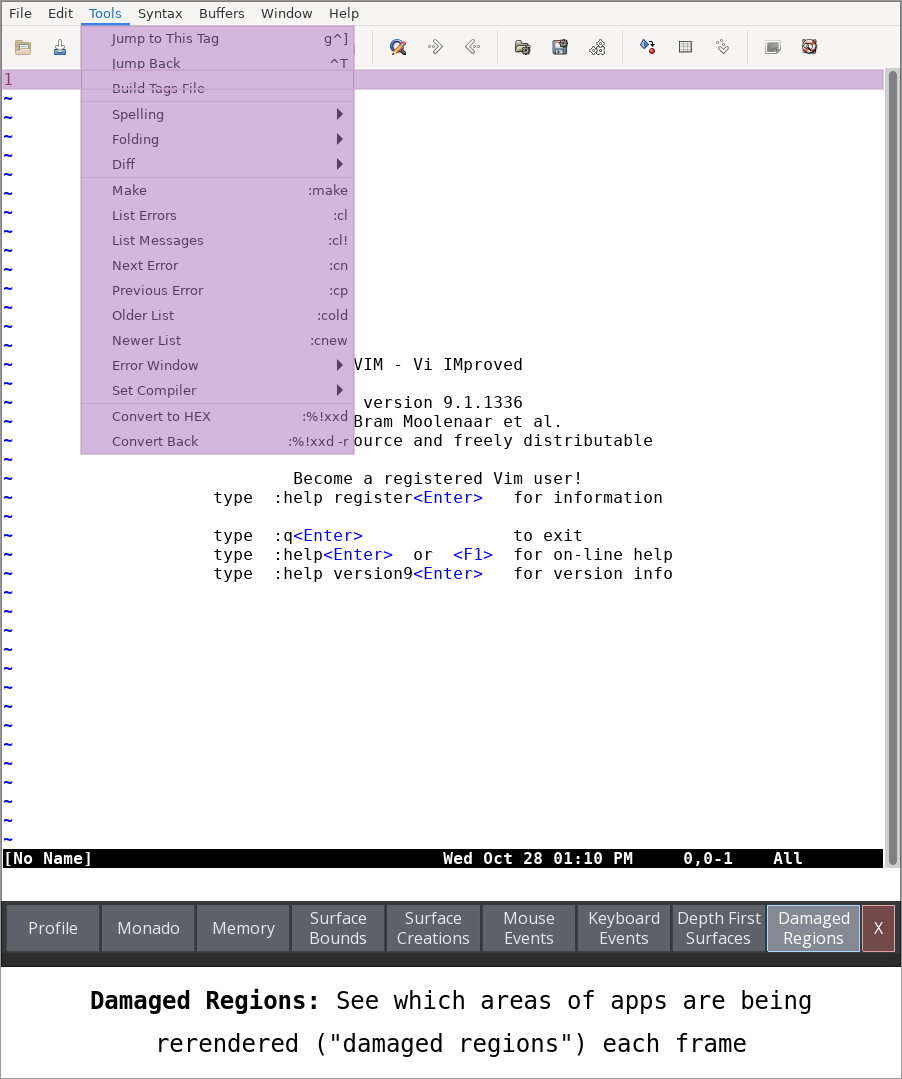
As you can see, the full popup itself makes up its own damaged region. But the active text line behind it is also being re-rendered (for some reason gvim thinks this is appropriate):
The second debug view is the ability to see the specific textures that are being blended over the damaged regions. For example, here we have the damaged region textures of Simula's default app launcher (synapse) as the user presses "f" followed by an "i". By the time "i" is pressed, the app launcher thinks Firefox is the app we want to launch:
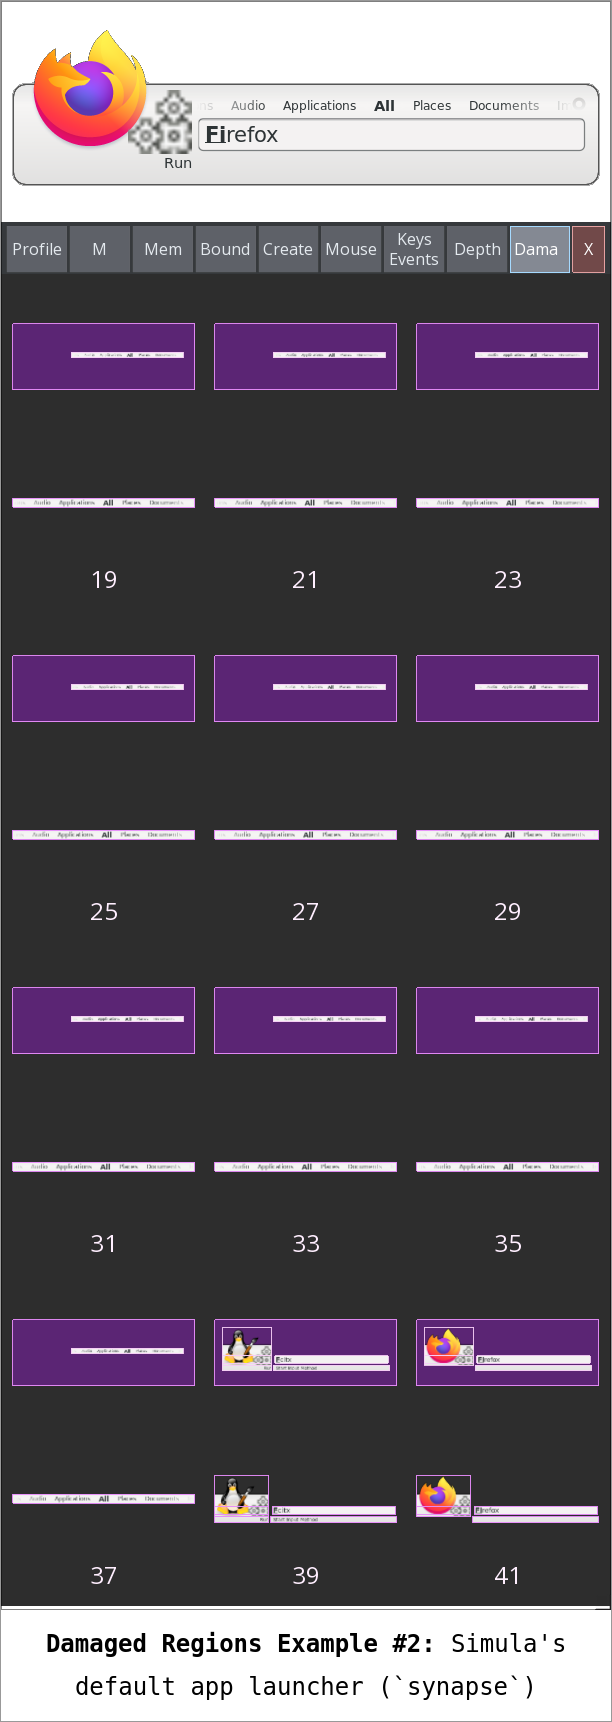
The debug overlay then shows;
- The relative frame number at which the texture was updated
- The location of the damaged region (top) with the new texture overlaying it
- The new texture itself below it (useful in case (2) is too small to otherwise see).
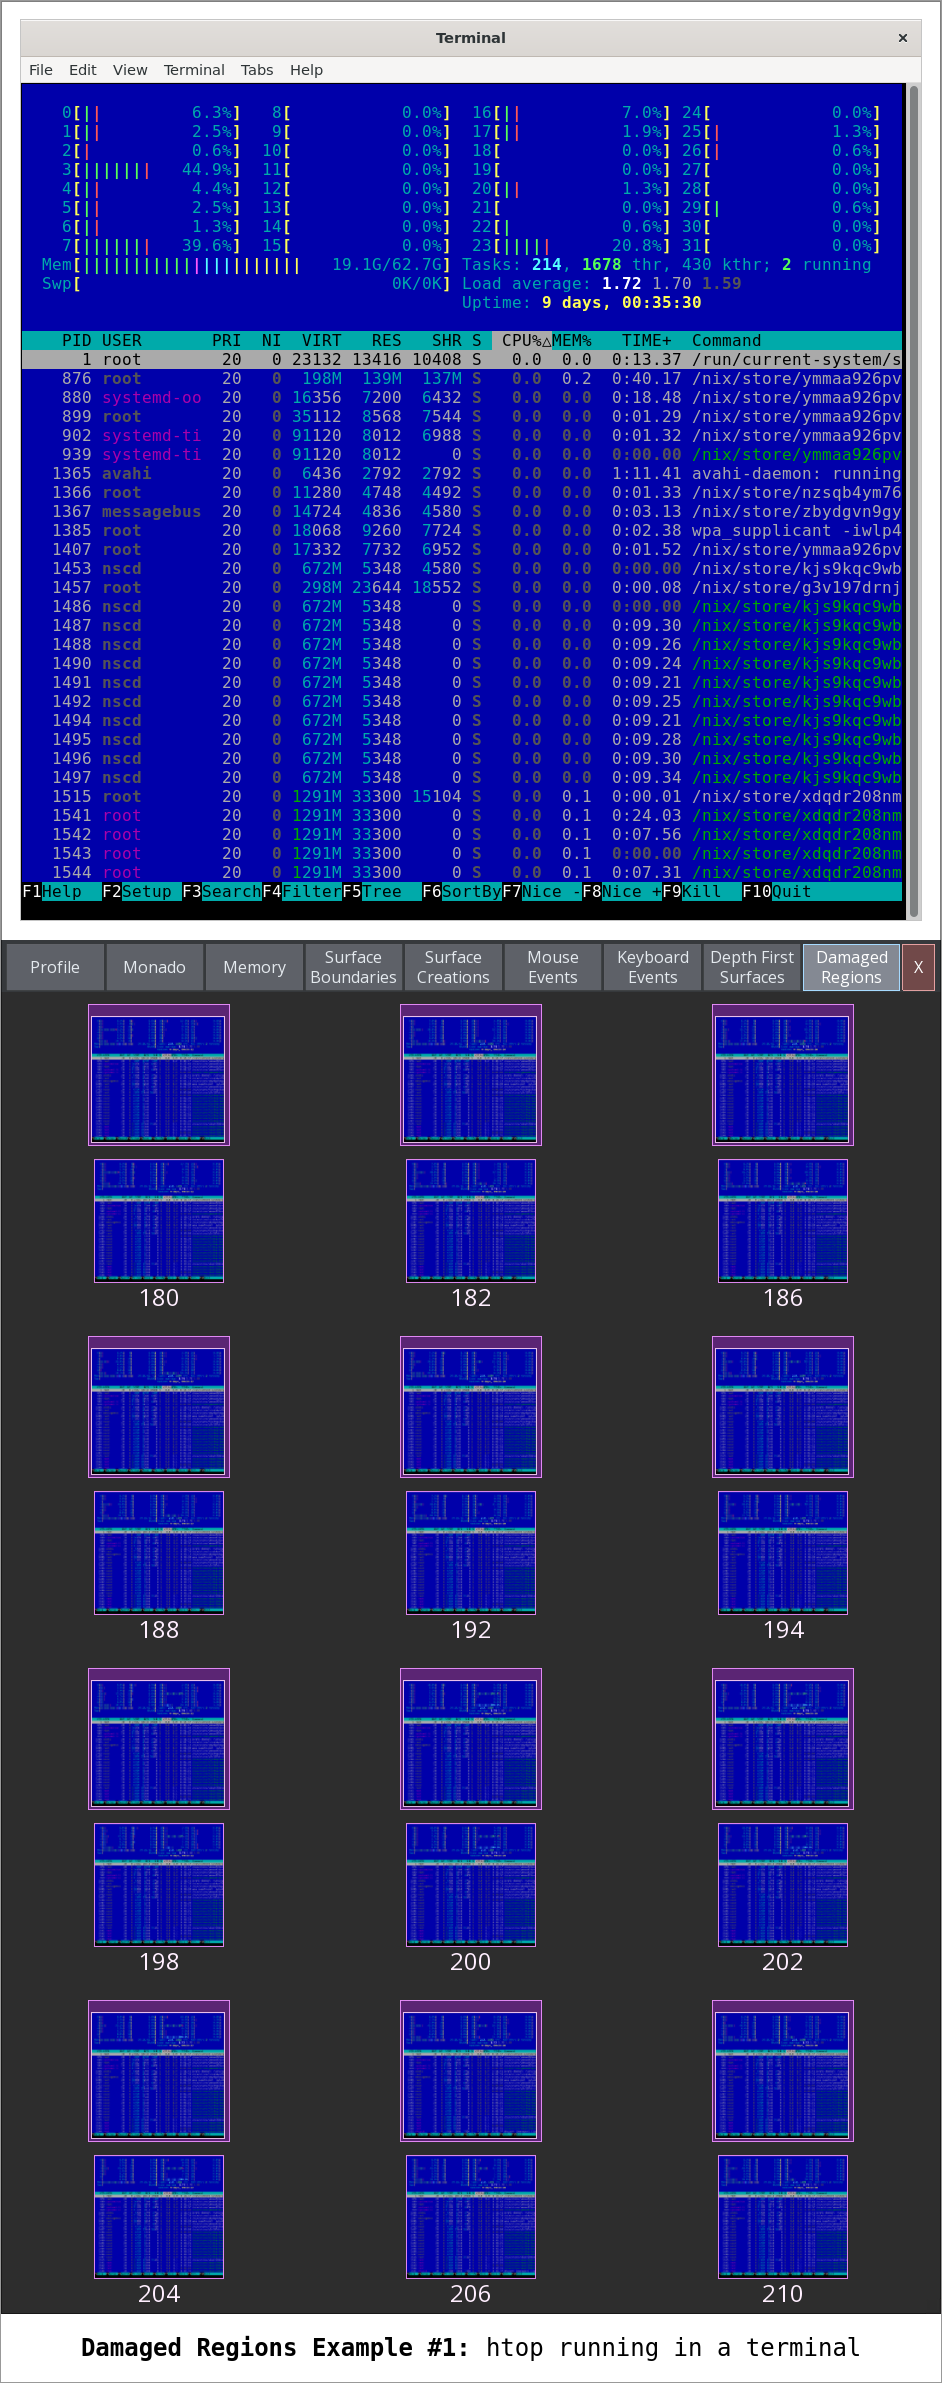
Very often a damaged region is just the entire app's surface itself. This is apparent for example with htop running in a terminal, where each redrawn frame is just the entire app itself:
This debug view has been tremendously useful. For example, we used it to solve an alpha-blending bug that we couldn't otherwise crack. But being able to see the textures being blended, live, made it obvious that our blending logic was the cause of weird artifacts.
But sometimes this view just shows that some Linux apps aren't very sophisticated in how they handle redrawing. Often you'll see huge regions of apps getting rerendered that don't seem to be necessary.
Inspecting the Rendering Depth Order of Subsurfaces
Linux apps often contain more than one surface. For example, when right-clicking an app: a menu pops up. This menu is an additional surface that needs to be rendered over the parent (main app) surface.
In theory, it should be pretty easy to render these subsurfaces correctly: first render the base app, then render the child surfaces according to the order of their hierarchy. Unfortunately, Linux apps have a myriad of subsurface types (with overlapping protocols, depending upon whether the app is X11 or Wayland), and our compositor has to properly intercept and handle all of them.
The end result is a depth hierarchy of subsurfaces which might not be correct. This is why we built a view to inspect this depth hierarchy:
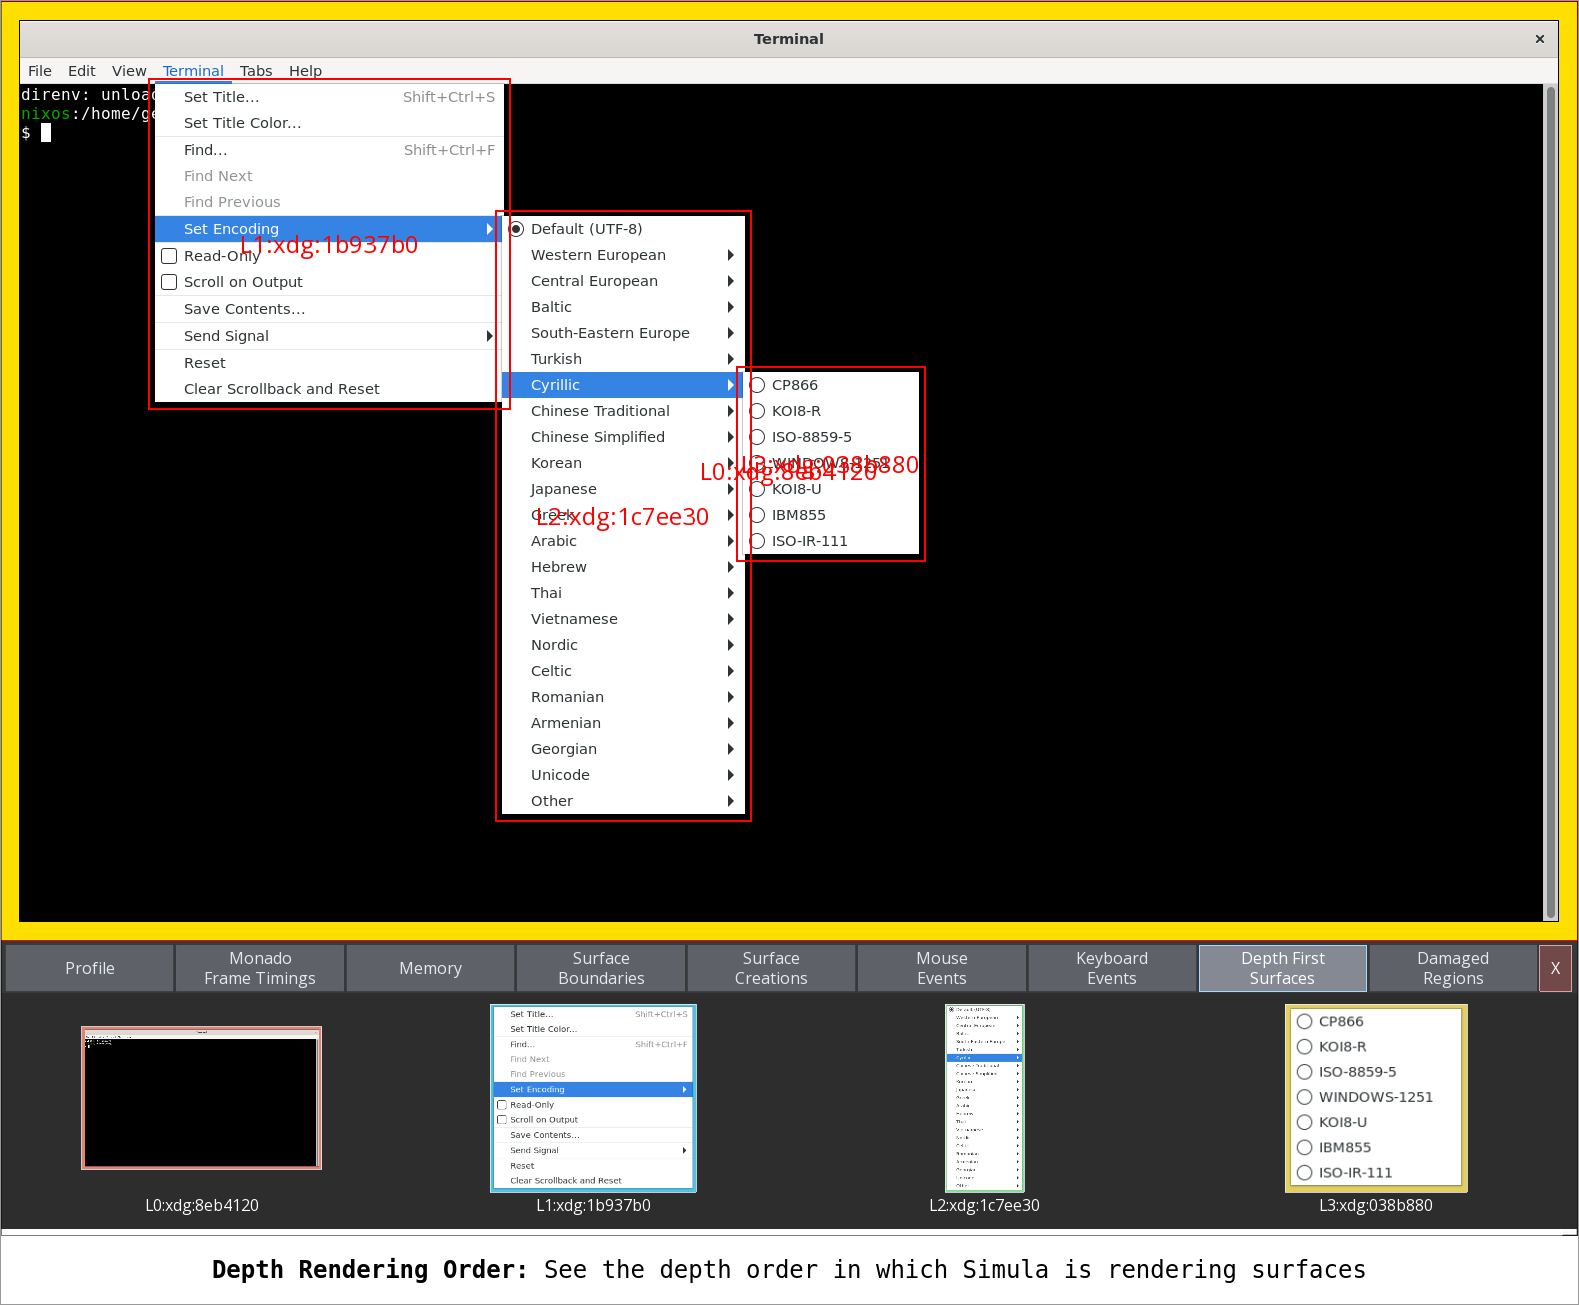
Here we see a terminal with multiple right-click menus. The debug overlay shows their pointer IDs (prepended with their layer number). On the bottom, we also see a flat listing of our subsurfaces in their depth order. This allows us to easily catch bugs where subsurfaces can be incorrectly sandwiched between/behind other subsurfaces (something we've indeed done in the past with this view).
Seeing Surface Boundaries
Sometimes what we need to inspect isn't the depth order of subsurfaces, but their size and placement over their parent surface. Believe it or not, different subsurfaces have different boundaries which are used for different computations (basically: raw framebuffer boundaries vs. the part of the framebuffer which is intended to be shown to the user). This is why our debug overlay shows all of them at once in different colors:
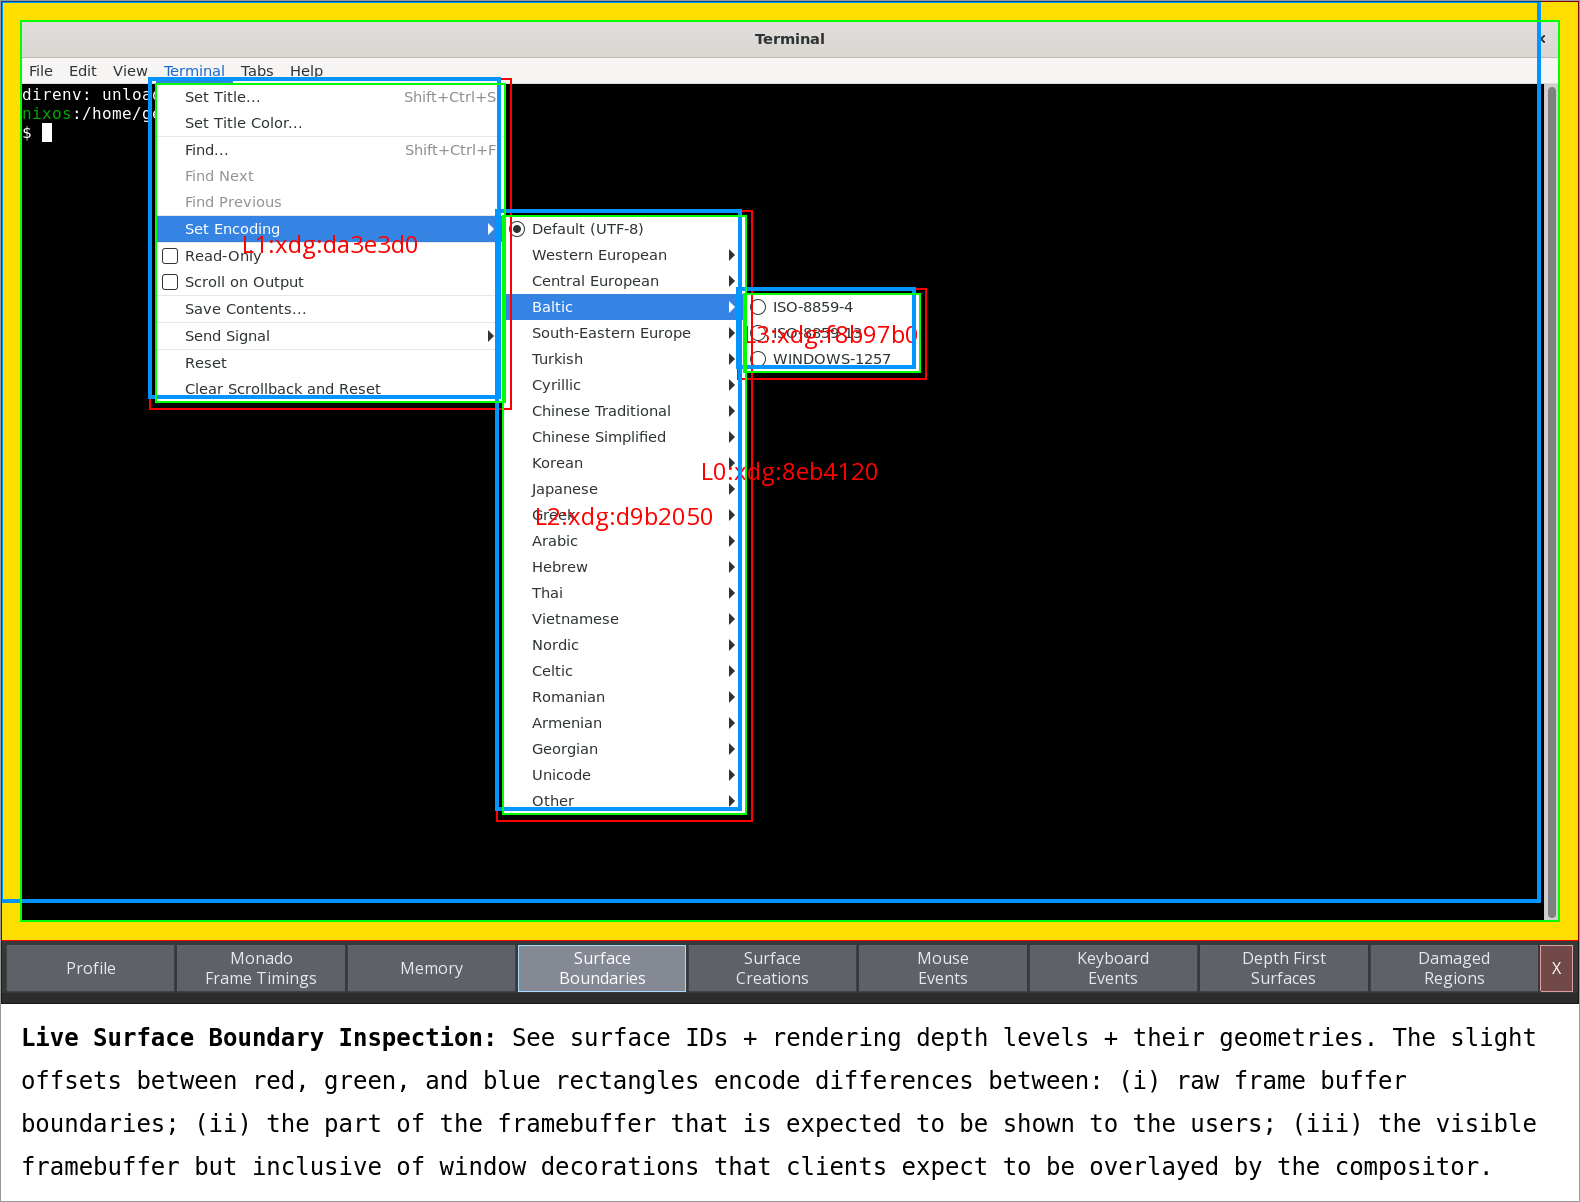
This view has allowed us to fix some very subtle cursor bugs (caused by using improper surface boundary offsets, which basically confused our compositor into thinking that our cursor was or wasn't over a subsurface when certain events were sent).
Surface Creation & Destruction Logging
We also have a pure log view for (sub)surface creations:
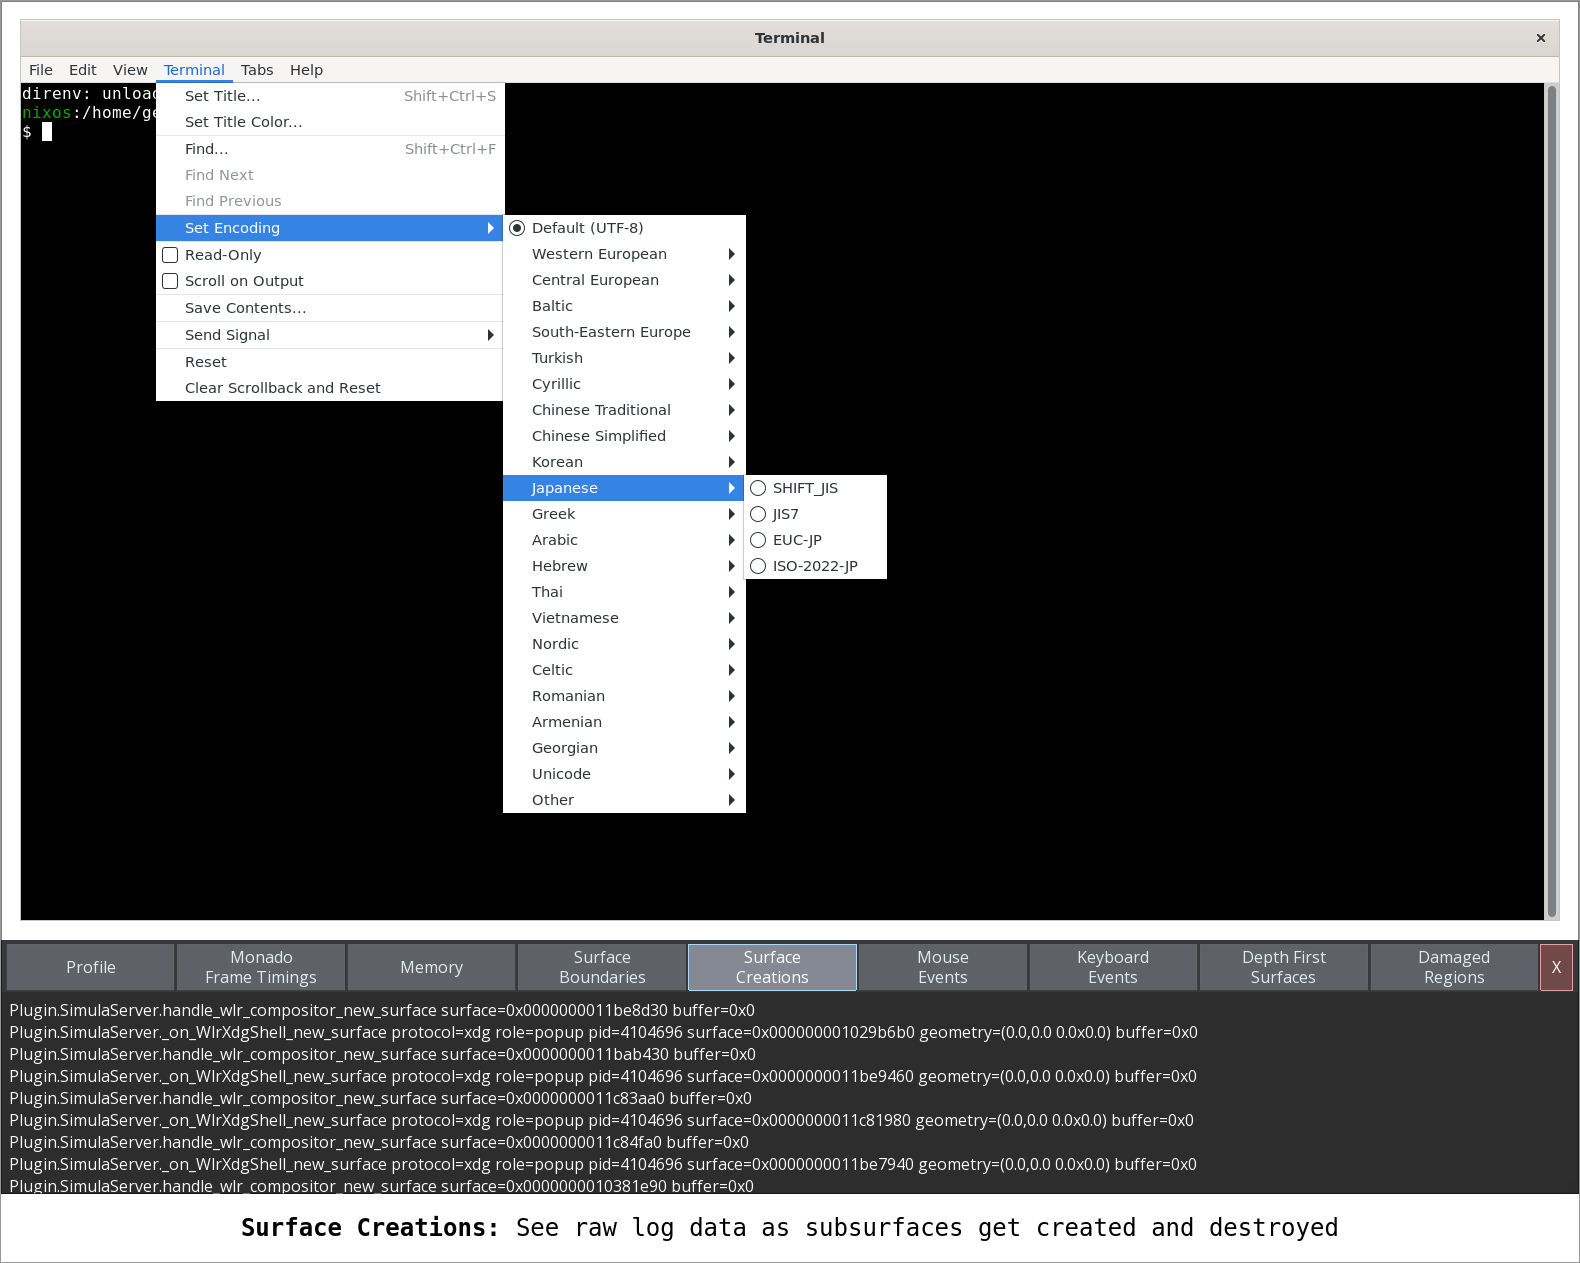
The reason why this is useful is that sometimes "invisible" subsurfaces get created that aren't meant to be rendered in the first place. So this view gives us a chance to inspect for them when we're expecting to see a surface but don't.
Mouse & Keyboard Events:
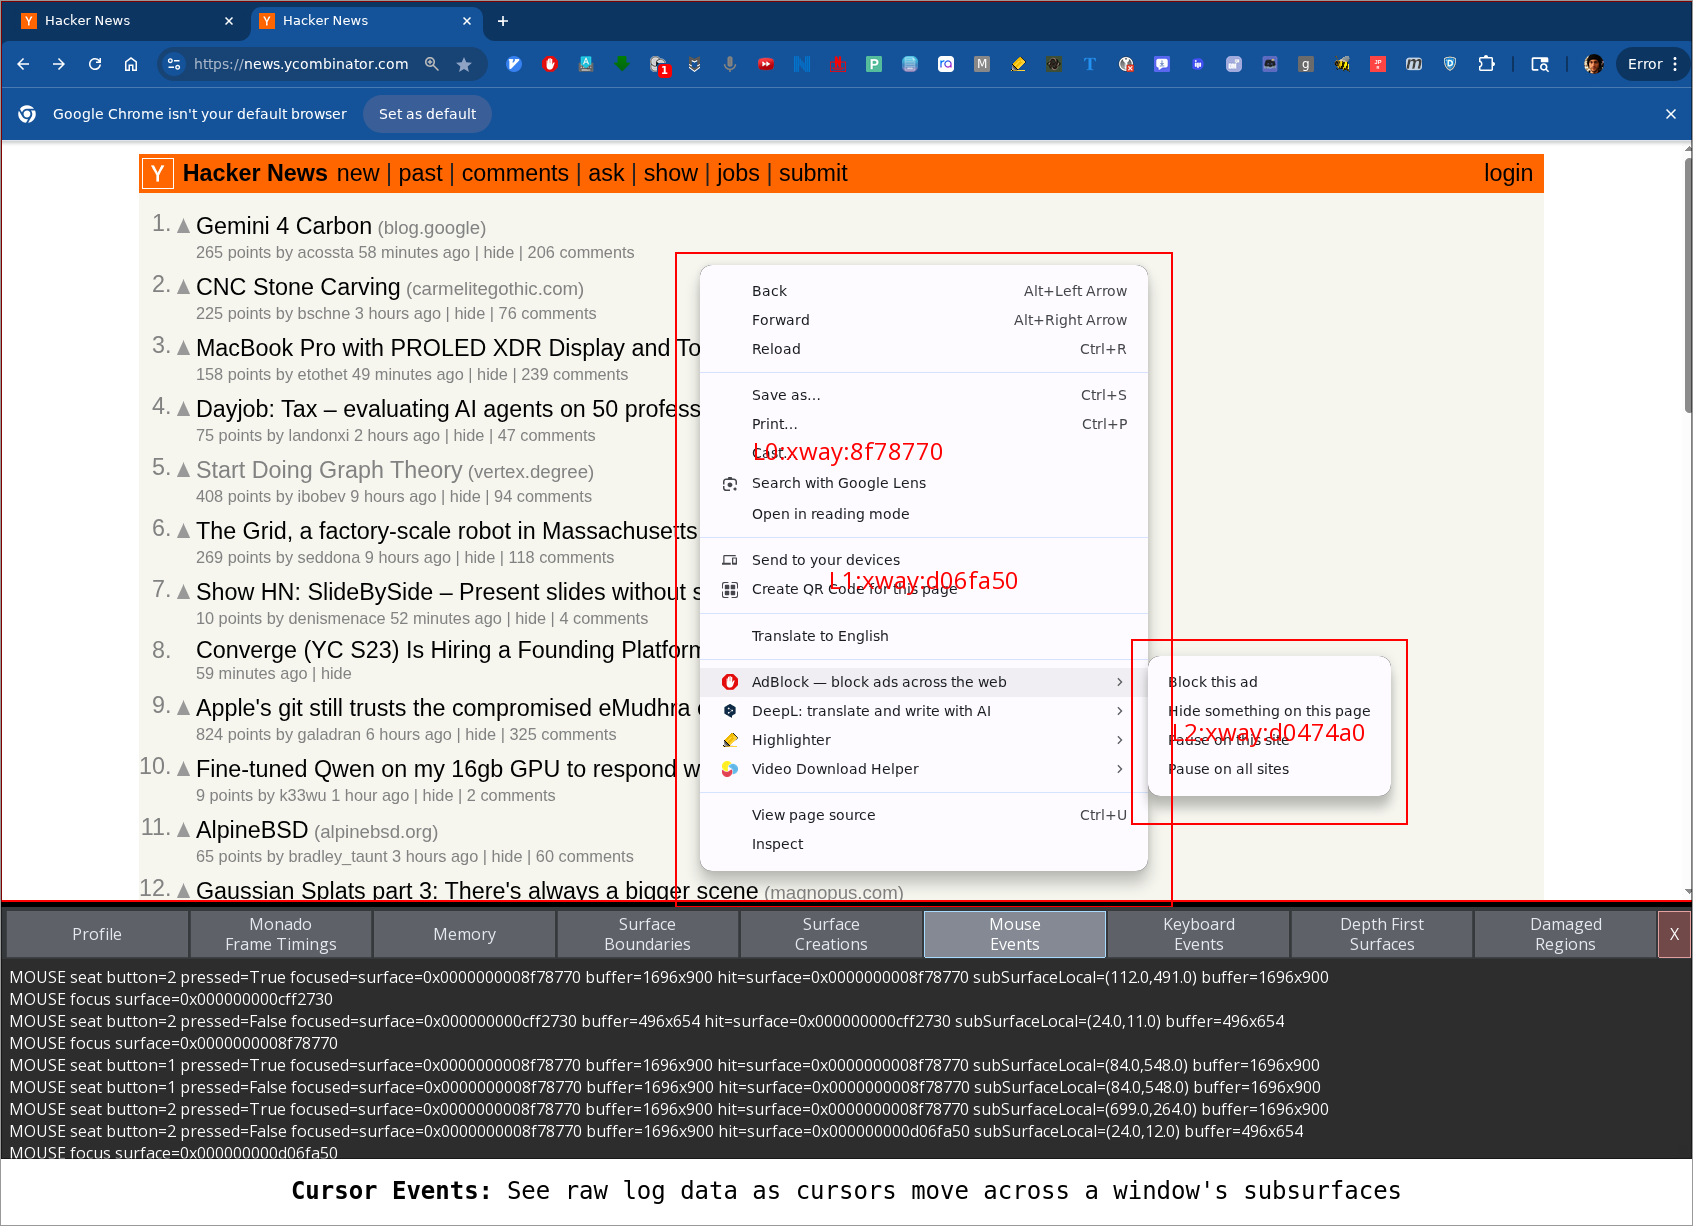
We similarly have a log view for mouse events:
...and also keyboard events:
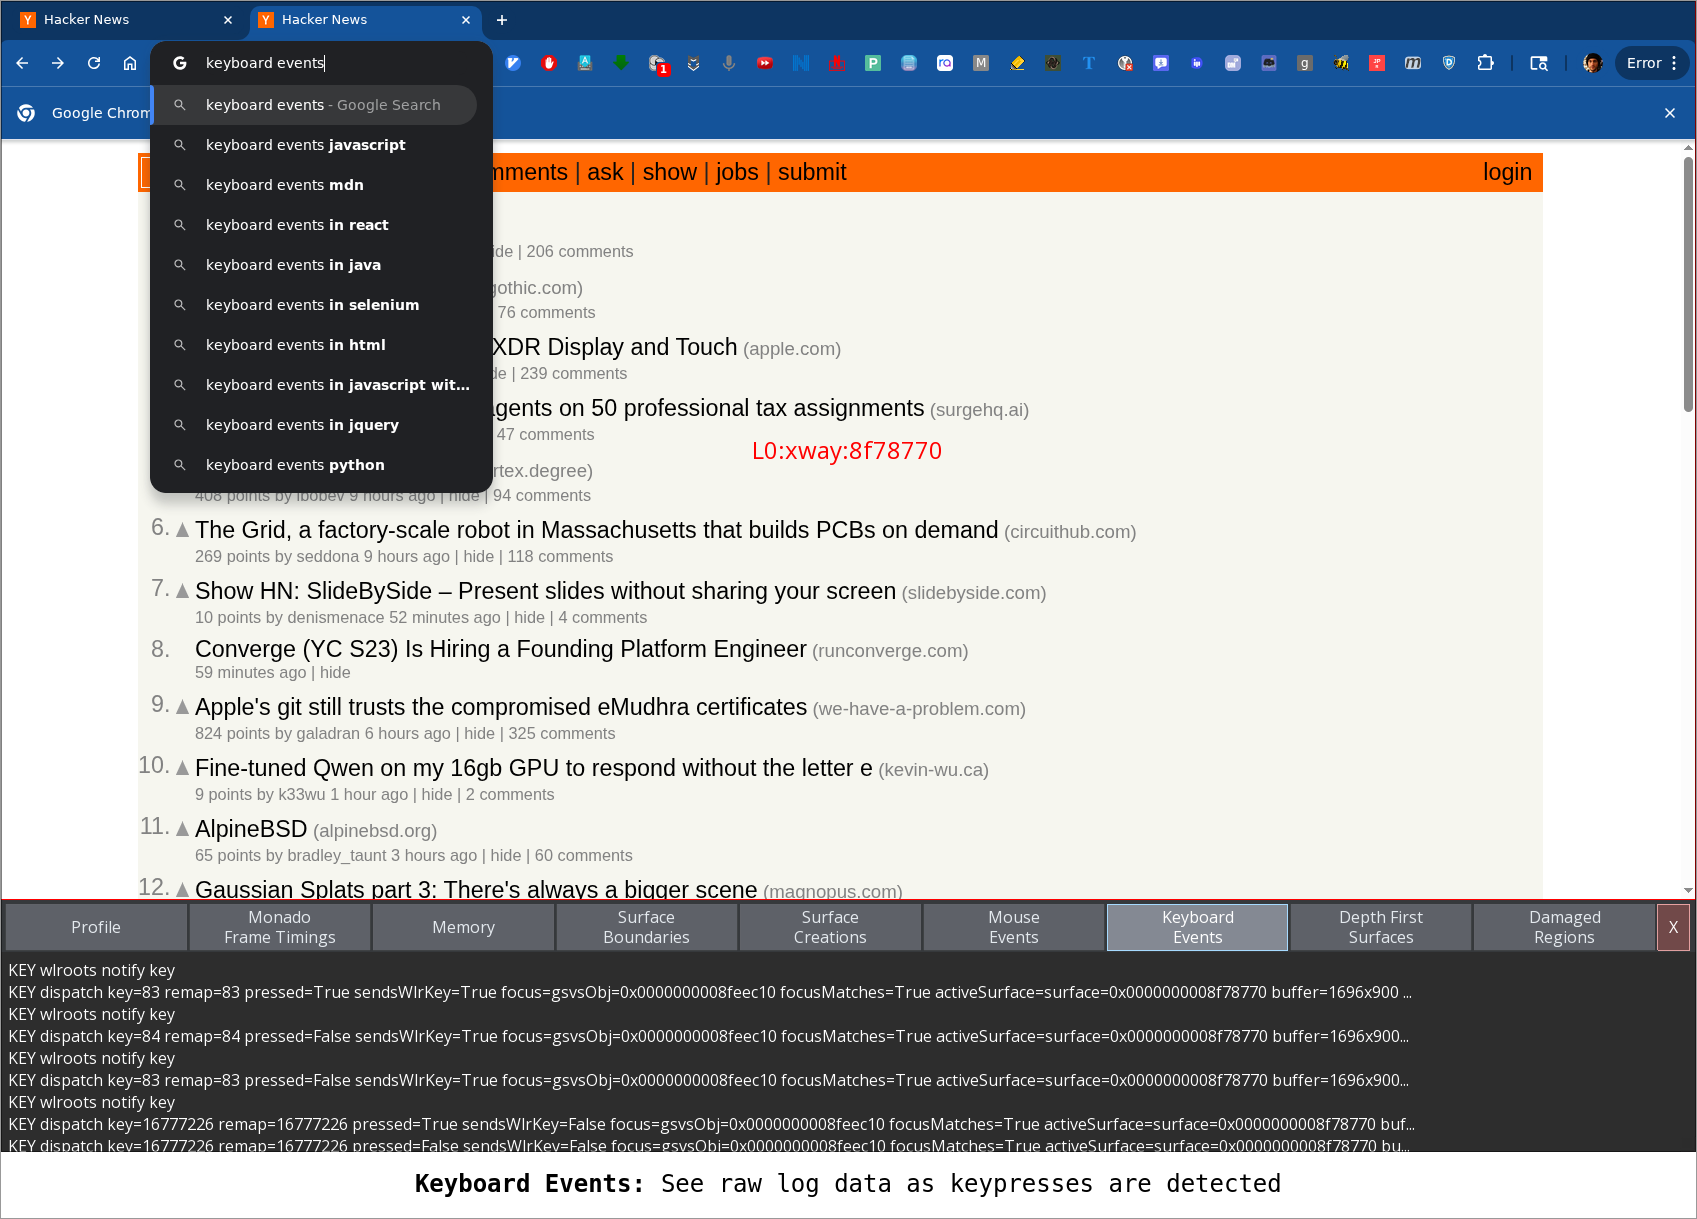
Wayland keyboard and mouse events can be complicated because different events need to be routed to different subsurfaces. For example: sometimes in order to get an event to show up on a subsurface, you need to route that event to its parent. So seeing how different input events are being routed to different subsurfaces can be a useful runtime view for fixing bugs.
Live Frame Budget Inspection
This is actually our favorite (and our most useful, and our most complicated) view! We recently used it to figure out how to make a major performance boost with only one flag adjustment. But this will be a seperate blog post :)